Hi,
I am adding points to a 3D graph. I use the data cursor to select the point, click and then the points get added to the graph.
I use the same coordinate transformation as detailed in the documentation, however when the points are plotted on the graph the centre point is not where I click. Probably best by showing some figures of what I mean.
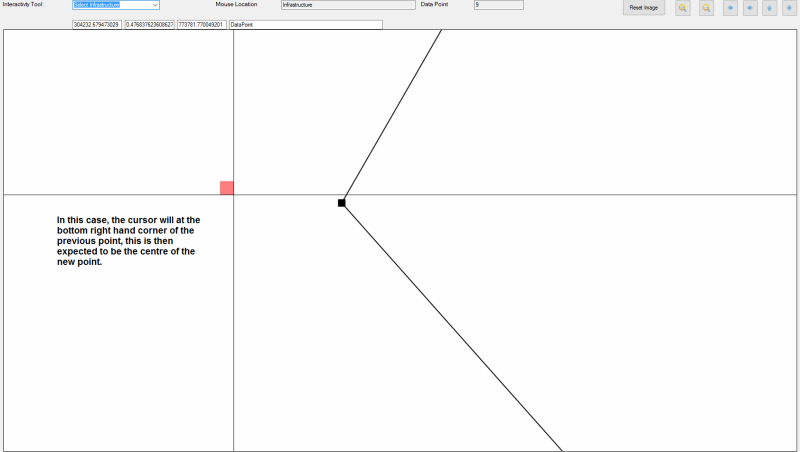
Figure 1. Cursor is where I want to add a point, note that I have positioned it at the corner of a previous point so as to highlight that the new point centre will not be at this corner.
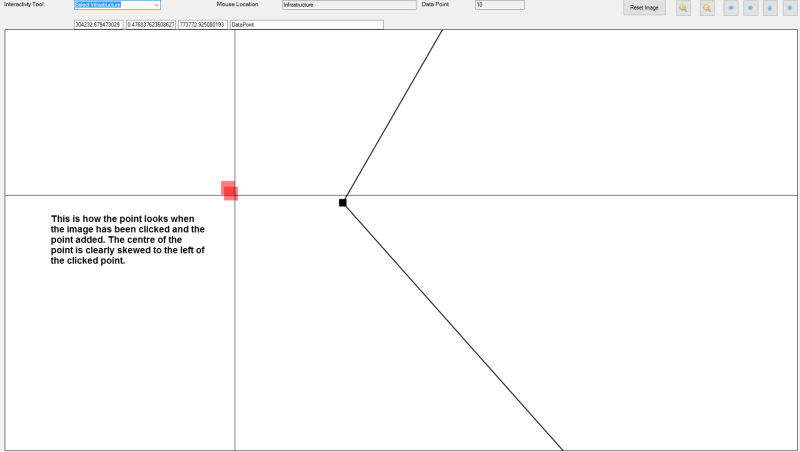
Figure 2. The new point centre is clearly skewed to the left of where I clicked.
Any idea why this has happened?
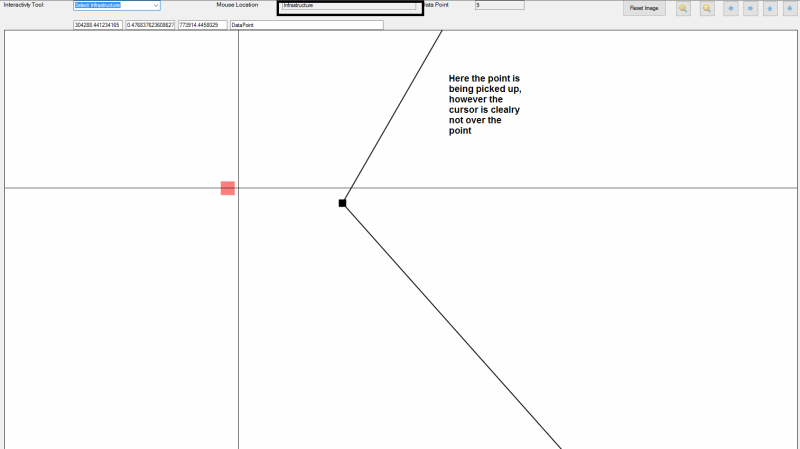
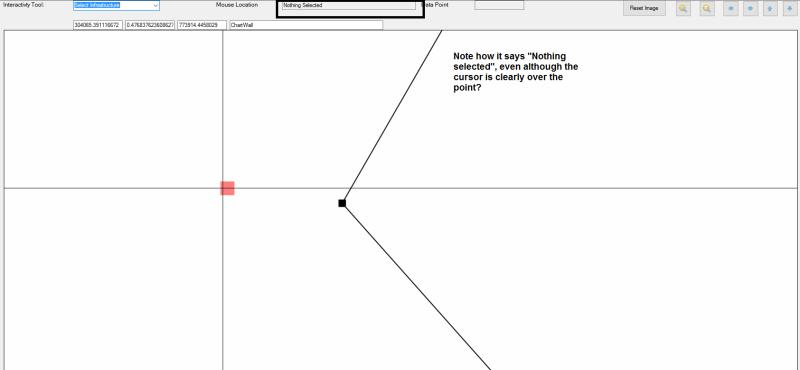
This has a knock on effect, when I come to modify the graph, as I then use hittesting to modify certain points, but what happens is that when the mouse is directly over the point, it comes as nothing selected (see Figure 3), however if we move just to the right of the point it picks up the point (see Figure 4). This all points to the actual point being more to the right and the actual label being used not being in the correct position.
Thoughts?
Thanks for looking.
Marcus
73% of original size (was 694x19) - Click to enlarge

73% of original size (was 694x19) - Click to enlarge

73% of original size (was 694x19) - Click to enlarge

73% of original size (was 694x19) - Click to enlarge
