|
Group: Forum Members
Last Active: 7 Years Ago
Posts: 29,
Visits: 61
|
Hi , I am adding points to a 3D graph . I use the data cursor to select the point , click and then the points get added to the graph . I use the same coordinate transformation as detailed in the documentation , however when the points are plotted on the graph the centre point is not where I click . Probably best by showing some figures of what I mean . Figure 1 . Cursor is where I want to add a point , note that I have positioned it at the corner of a previous point so as to highlight that the new point centre will not be at this corner . Figure 2 . The new point centre is clearly skewed to the left of where I clicked . Any idea why this has happened ? This has a knock on effect , when I come to modify the graph , as I then use hittesting to modify certain points , but what happens is that when the mouse is directly over the point , it comes as nothing selected ( see Figure 3 ), however if we move just to the right of the point it picks up the point ( see Figure 4 ). This all points to the actual point being more to the right and the actual label being used not being in the correct position . Thoughts ? Thanks for looking . Marcus 73% of original size (was 694x19) - Click to enlarge 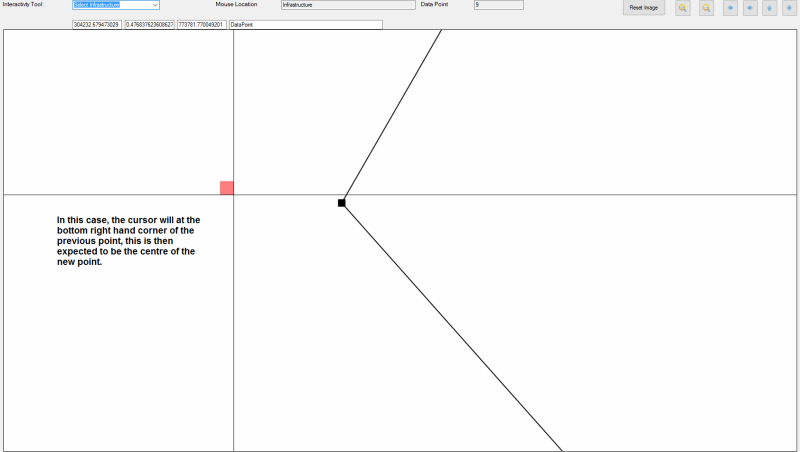 73% of original size (was 694x19) - Click to enlarge  73% of original size (was 694x19) - Click to enlarge 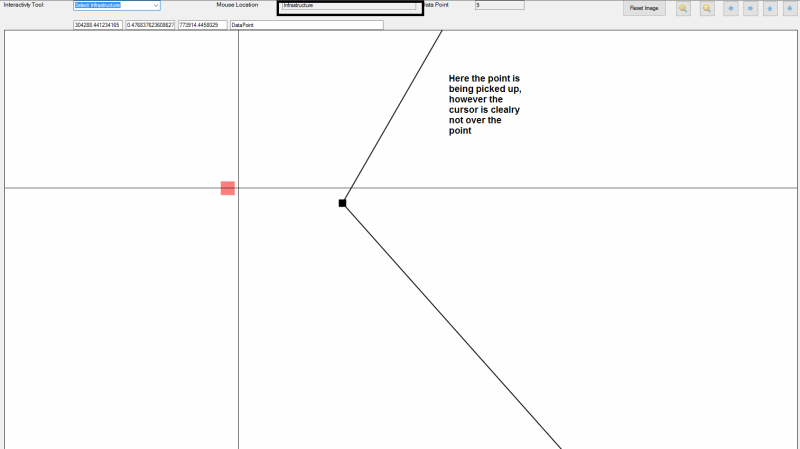 73% of original size (was 694x19) - Click to enlarge 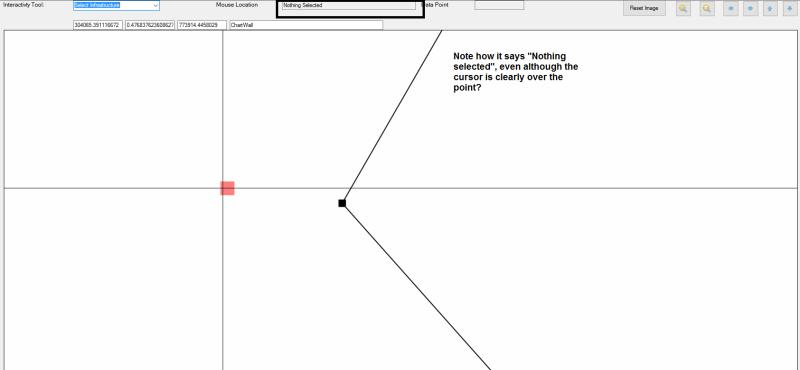
|


