Profile Picture

HeatMapChart - After Zoom Chart fills entire Chart panel

Posted By joern kunze 8 Years Ago

HeatMapChart - After Zoom Chart fills entire Chart panel

Author
Message
joern kunze
Posted 8 Years Ago
View Quick Profile
Junior Member

Junior Member (13 reputation)Junior Member (13 reputation)Junior Member (13 reputation)Junior Member (13 reputation)Junior Member (13 reputation)Junior Member (13 reputation)Junior Member (13 reputation)Junior Member (13 reputation)Junior Member (13 reputation)

Group: Forum Members
Last Active: 3 Months Ago
Posts: 86, Visits: 221
Hi Experts,

when I apply a Zoom-Control to a HeatMapChart, basically it works. But after zooming in, the Chart now fills the entire Chart panel:
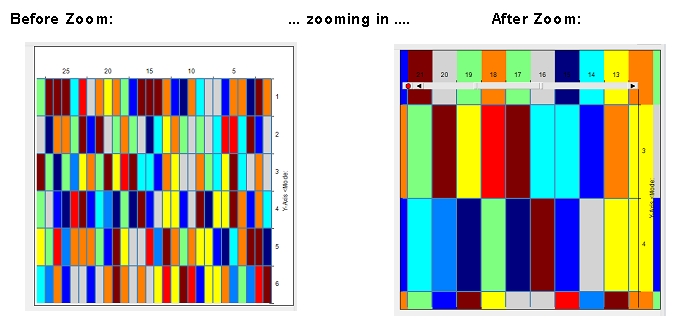
https://www.nevron.com/forum/uploads/images/2adb3079-7150-4a5e-8408-f36b.jpg
The zoom functionality is implemented for various other Chart Types (line, point, bar...) in the same way - but none of the other Chart Types shows this behaviour. How can I force the HeatMapChart to fill the Chart panel only within the axis-bounds ?

Thanks for the help,
Joern


Similar Topics


Reading This Topic