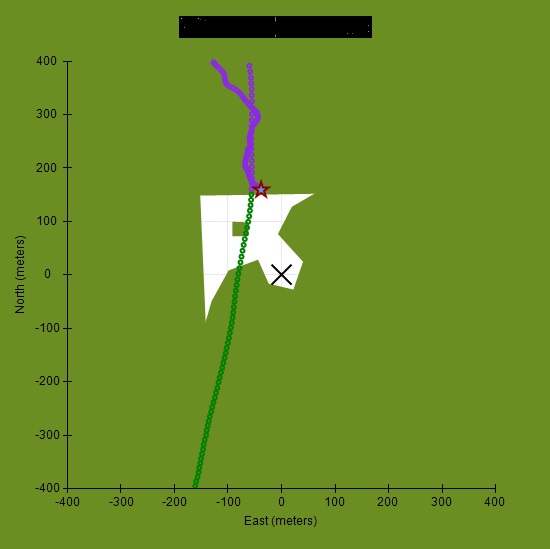
I am using a custom series to paint polygons on a chart, but the paint (green) covers the entire chart.
How do I use custom series to paint within the chart area only? -400 to 400 on both axis below. Leaving the axis labels white.

My guess is that there is some way to clip the custom series drawing area so it only paints on the chart area and not on the chart axis notations, but have not stumbled upon such a method in the documentation or the forum.
Any help is appreciated.
Thanks,
Harry Kindle