|
Group: Forum Members
Last Active: Last Month
Posts: 3,055,
Visits: 4,055
|
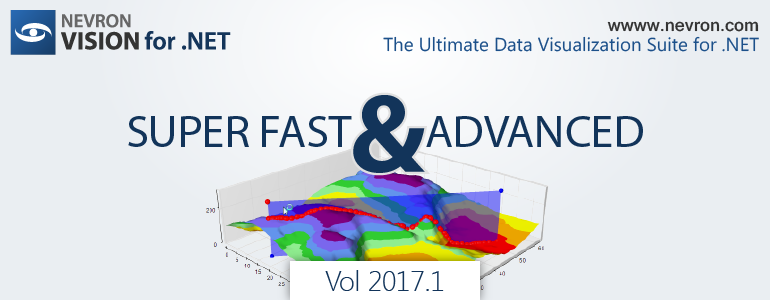
59% of original size (was 856x19) - Click to enlarge  Wilmington , Delaware — Jun 06 , 2017 & nbsp ; Nevron Software announces the official release of Nevron Vision for . NET 2017 . 1 – the leading component suite for . NET data visualization !& nbsp ; The new release introduces great new features in & nbsp ; Nevron Chart for .NET& nbsp ; to extend the data visualization capabilities of the most advanced . NET charting component . Following is a summary of the new features introduced by the 2017.1 release:The Ternary Point series displays point in a ternary coordinate system . Each point is specified by its A , B and C values which sum to a con stant . The Ternary Bubble series displays bubbles in a ternary coordinate system . Each bubble is specified by its A , B and C values which sum to a con stant and also has a fourth parameter that determines its size . The Point Series now supports drop lines . Drop lines are lines which extend from the point X , Y , Z value to the chart walls . Optionally drop lines can extend to the axis Min , Max value or to a user specified value ( drop lines origin ). The Bar Series now supports connector lines between adjacent bars . The Float Bar Series now supports connector lines between adjacent bars begin / end values . In addition it also supports Gantt connector between the bar end value and one or more bars begin values . This feature allows you to easily display Gantt charts . The Heat Map Series supports annotated contours . The user can specify the formatting of the contour value ( elevation ). the di stance between labels along the contour , whether the labels orientation must follow the contour slope , whether the label should clip the contour line it annotates and others . The Heat Map Series can generate a list of points that form the contour cross section which is defined by crossing the heat map with a plane defined by two points that lie on the map . The grid surface supports extraction of the grid surface profile ( cross section ) which is generated by intersecting the surface with a horizontal plane or an arbitrary vertical cross plane . The Step Line series supports intersection with arbitrary X or Y value . The Annotation Drag Tool allows the user to interactively drag annotations attached to different chart anchors ( data points , scale coordinates , legend items etc .). The Range Selection Drag Tool allows the users to interactively drag and resize a range selection object . This tool allows you to interactively select a 3D volume defined by four planes ( left , top , right and bottom ) that can be later used to quickly check whether a 3D point is contained in the volume enclosed by the selection planes . This tool allows you to interactively zoom in or out an area of the panel . Nevron Chart for WFP now has better WFP integration . The control has also has many new examples for WFP . The new version features fixes all reported problems as well numerous small performance improvements in the control . Nevron Vision for . NET now provides full support for Visual Studio 2017 ! For a limited time * you can purchase Nevron Vision for . NET , or the separate components in the suite , with a 30 % discount ! Use the following discount coupon & nbsp ; NETVISION2017Vol1before you checkout !& nbsp ; PURCHASE NOW* Valid until 30th of June, 2017
Best Regards,
Nevron Support Team
|