Hi,
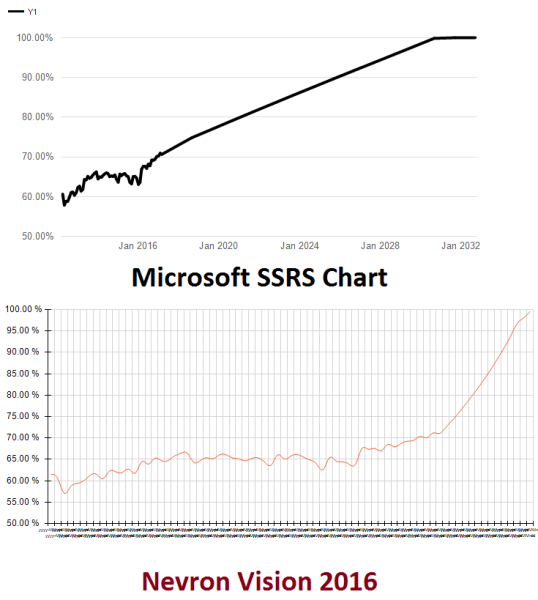
In my smooth-line plot, the x-values are dates and the y-values are percentages.
The issue is that I have monthly values at the beginning section of my plot, however, after two years, the dates are updated on yearly basis, therefore the dates do not have consistent intervals.
Please find attached the plot I've created using the Microsoft chart control. I would like to use Nevron to reproduce this plot but unfortunately it treats the dates as categories and not datetime variables.
Thanks a lot for your help

