|
Group: Forum Members
Last Active: 3 Years Ago
Posts: 11,
Visits: 67
|
Hi , In my smooth - line plot ,& nbsp ; the & nbsp ; x - values are dates and the y - values are percentages . The issue is that I have monthly values at the beginning section of my plot , however , after two years , the dates are updated on yearly basis , therefore the dates do not have consistent intervals . Please find attached the plot I ' ve created using the Microsoft chart control . I would like to use Nevron to reproduce this plot but unfortunately it treats the dates as categories and not datetime variables . Thanks a lot for your help  & nbsp ; 72% of original size (was 697x19) - Click to enlarge 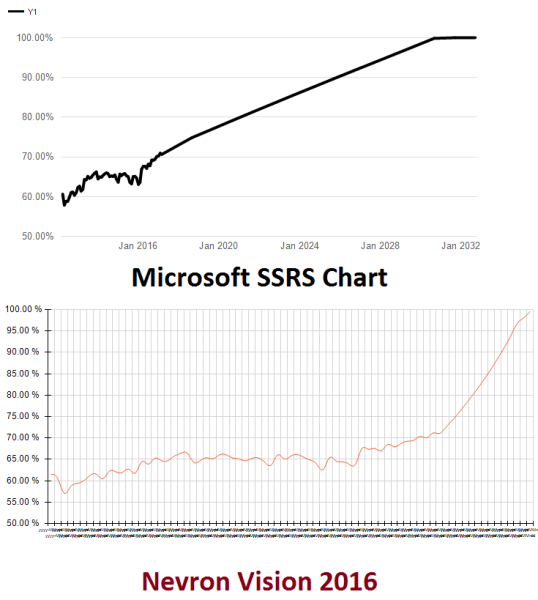
|
|
Group: Forum Members
Last Active: Last Month
Posts: 3,055,
Visits: 4,055
|
Hello Vahid , What is the data type for the X axis - are you using Date Time or String values ? You should be able to switch the Smooth Line - Sub Type to : XY Scatter . Then in the Values Grouping Editor , you need to pass the X value ( for example : = Fields ! Date . Value ). From the Chart Areas -& gt ; Axes -& gt ; Primary X -& gt ; Scale tab , from Numeric tab , you can choose Date Time sub type and you can configure the formatting . You can check some of the report examples shipped with the installation ( for example : CalculatedSeries_PolynomialRegression . rdl ). Hopefully this helps . Let us know if you have any questions or if you need assistance .
Best Regards,
Nevron Support Team
|
|
Group: Forum Members
Last Active: 3 Years Ago
Posts: 11,
Visits: 67
|
Thanks a lot for your reply . Indeed , changing the plot sub type to XY scatter did solve my problem , however , no I ' m experiencing a new issue with x - axis labels .& nbsp ; 72% of original size (was 697x19) - Click to enlarge 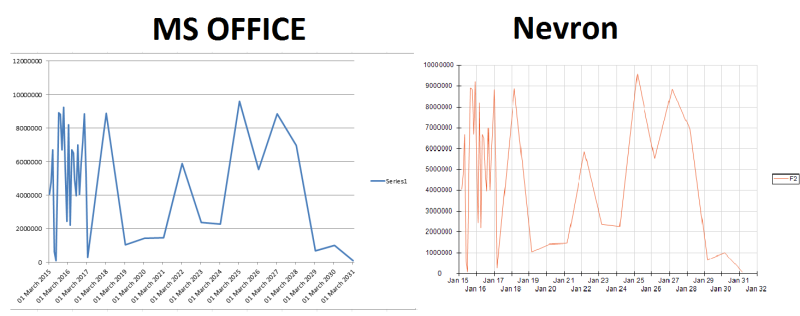 I would like to reproduce the plot on the left - side using Nevron The issue is that the x - axis in my data ( testData . csv ) consists of dates commencing from March 2015 but Nevron selects Jan 2015 when generating the labels automatically . Please note that the time - differences between the dates are not equal . Even when I set the x - axis scale to have custom steps & nbsp ; and set the start range of my plot to March 2015 , the generated lables in Nevron begin from January 2015 ( and not March ). Thanks alot p . s . I ' ve attached the csv and rdl . to replicate , please remove the ". txt " extension and copy the csv file to " c :\ rep "
|
|
Group: Forum Members
Last Active: Last Month
Posts: 3,055,
Visits: 4,055
|
Hello Vahid , This is caused by the default axis scaling . You can use the following custom C # code : using System;
using System.Drawing;
using Nevron.GraphicsCore;
using Nevron.Chart;
using Nevron.ReportingServices;
namespace MyNamespace
{
/// <summary>
/// Sample class
/// </summary>
public class MyClass
{
/// <summary>
/// Main entry point
/// </summary>
/// <param name="context"></param>
public static void RSMain(NRSChartCodeContext context)
{
NChart chart = context.document.Charts[0];
NDateTimeScaleConfigurator dateTimeScale = chart.Axis(StandardAxis.PrimaryX).ScaleConfigurator as NDateTimeScaleConfigurator;
if (dateTimeScale != null)
{
bool hasMin = false;
DateTime minValue = new DateTime();
foreach (NSeriesBase series in chart.Series)
{
NXYScatterSeries xyScatter = series as NXYScatterSeries;
if (xyScatter != null && xyScatter.XValues.Count > 0)
{
DateTime curXValue = DateTime.FromOADate((double)xyScatter.XValues[0]);
if (hasMin)
{
minValue = minValue < curXValue ? minValue : curXValue;
}
else
{
hasMin = true;
minValue = curXValue;
}
}
}
if (hasMin)
{
dateTimeScale.UseOrigin = true;
dateTimeScale.Origin = new DateTime(minValue.Year, minValue.Month, 1, 0, 0, 0);
}
}
}
}
} using System;
using System.Drawing;
using Nevron.GraphicsCore;
using Nevron.Chart;
using Nevron.ReportingServices;
namespace MyNamespace
{
/// <summary>
/// Sample class
/// </summary>
public class MyClass
{
/// <summary>
/// Main entry point
/// </summary>
/// <param name="context"></param>
public static void RSMain(NRSChartCodeContext context)
{
NChart chart = context.document.Charts[0];
NDateTimeScaleConfigurator dateTimeScale = chart.Axis(StandardAxis.PrimaryX).ScaleConfigurator as NDateTimeScaleConfigurator;
if (dateTimeScale != null)
{
bool hasMin = false;
DateTime minValue = new DateTime();
foreach (NSeriesBase series in chart.Series)
{
NXYScatterSeries xyScatter = series as NXYScatterSeries;
if (xyScatter != null && xyScatter.XValues.Count > 0)
{
DateTime curXValue = DateTime.FromOADate((double)xyScatter.XValues[0]);
if (hasMin)
{
minValue = minValue < curXValue ? minValue : curXValue;
}
else
{
hasMin = true;
minValue = curXValue;
}
}
}
if (hasMin)
{
dateTimeScale.UseOrigin = true;
dateTimeScale.Origin = new DateTime(minValue.Year, minValue.Month, 1, 0, 0, 0);
}
}
}
}
}
Best Regards,
Nevron Support Team
|


