|
Group: Forum Members
Last Active: 5 Years Ago
Posts: 49,
Visits: 179
|
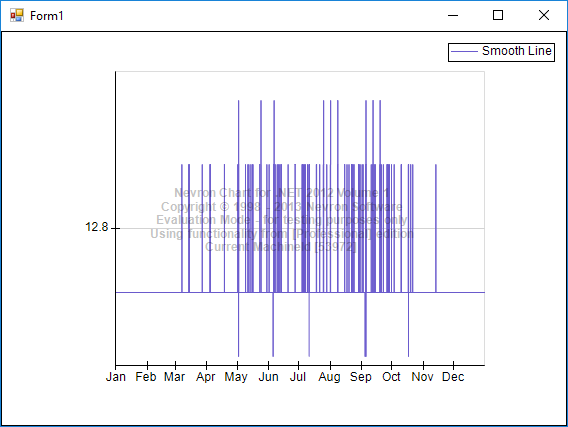
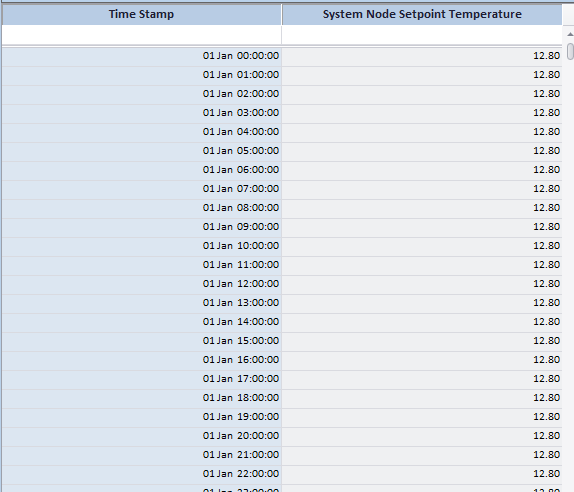
Hi Team, I am drawing line series with DataTime Scale on X-axis. I found an issue that chart draws wrong when data values are same for all series points. See below images for drawn chart and chart values: 73% of original size (was 690x19) - Click to enlarge  Actual Data is as below: 73% of original size (was 690x19) - Click to enlarge  You can find running sample project at - https://github.com/niranjankala/Nevron.git. This sample project uses Nevron version 13.8.26.12. Kindly suggest the settings to solve the issue. Thanks, Niranjan
|
|
Group: Forum Members
Last Active: 9 hours ago
Posts: 3,055,
Visits: 4,058
|
Hi Niranjan, We were not able to replicate this issue with the latest version of the control. In the newer version you also have the option to use spline line segments in the regular line series:
line.PolylineRenderMode = PolylineRenderMode.Curve;
Let us know if you meet any problems.
Best Regards,
Nevron Support Team
|
|
Group: Forum Members
Last Active: 5 Years Ago
Posts: 49,
Visits: 179
|
Thanks for the reply.
It is good that it works fine with the newer version of Nevron Vision, but is there any workaround to make it work in the older version?
|
|
Group: Forum Members
Last Active: 9 hours ago
Posts: 3,055,
Visits: 4,058
|
Hi Niranjan, We're not aware of any workarounds for the smooth line in this version. Please consider upgrading to the latest version of the control, which is actively supported / maintained.
Best Regards,
Nevron Support Team
|