|
Group: Forum Members
Last Active: 5 Years Ago
Posts: 49,
Visits: 179
|
Hi Team, I am drawing line series with DataTime Scale on X-axis. I found an issue that chart draws wrong when data values are same for all series points. See below images for drawn chart and chart values: 73% of original size (was 690x19) - Click to enlarge 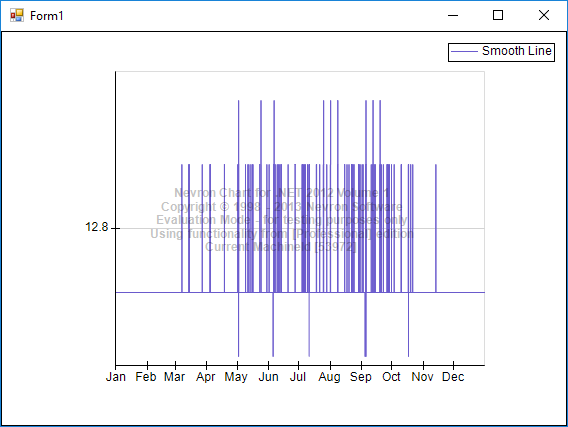 Actual Data is as below: 73% of original size (was 690x19) - Click to enlarge 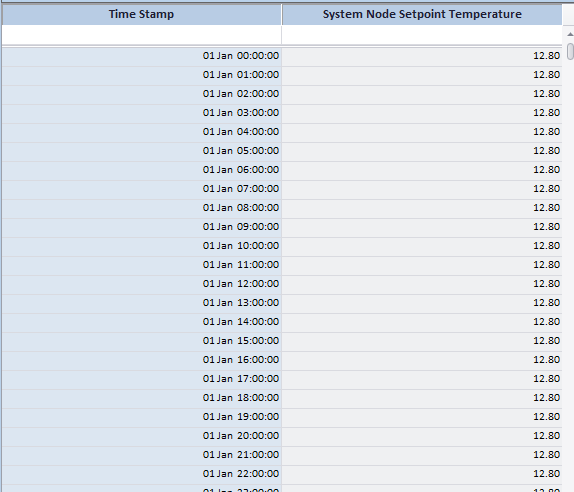 You can find running sample project at - https://github.com/niranjankala/Nevron.git. This sample project uses Nevron version 13.8.26.12. Kindly suggest the settings to solve the issue. Thanks, Niranjan
|


