Hi Experts,
I have a ThinWebClient
Chart with 2 Line Types with several series: NQuickPointSeries or NLineSeries. There is no mixed mode with the 2 series types it is either NQuickPointSeries or NLineSeries plotted.
The Legend for the chart is created with the following code: NThin
ChartControl1.Legends.Clear();
NThin
ChartControl1.Legends.Add();
NLegend legend = NThin
ChartControl1.Legends[0];
legend.DockMode = PanelDockMode.Top;
legend.Padding = new NMarginsL(1, 1, 3, 3);
legend.FillStyle.SetTransparencyPercent(20);
legend.OuterBottom
BorderStyle.Width = new NLength(1, NGraphicsUnit.Pixel);
legend.OuterLeft
BorderStyle.Width = new NLength(1, NGraphicsUnit.Pixel);
legend.OuterRight
BorderStyle.Width = new NLength(1, NGraphicsUnit.Pixel);
legend.OuterTop
BorderStyle.Width = new NLength(1, NGraphicsUnit.Pixel);
legend.Horizontal
BorderStyle.Width = new NLength(0, NGraphicsUnit.Pixel);
legend.Vertical
BorderStyle.Width = new NLength(0, NGraphicsUnit.Pixel);
NThin
ChartControl1.Legends[0].VisibilityMode = VisibilityMode.Visible;
chart.DisplayOnLegend = legend;
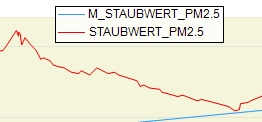
For the
NLineSeries everything is ok:
92% of original size (was 546x24) - Click to enlarge
but for the NQuickPointSeries no coloured dot before the series name according to the series colour is shown:
92% of original size (was 546x24) - Click to enlarge
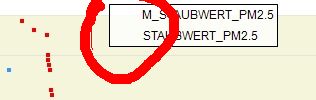
How do I force the coloured dots to be visible in the legend?
Thanks for the help,
Best regards,
Joern


