|
Group: Forum Members
Last Active: 2 Years Ago
Posts: 33,
Visits: 76
|
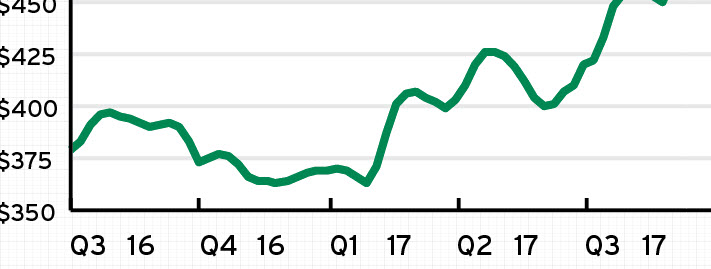
In the chart I am generating the space between the Quarter and Year is more pronounced than it should be, it looks more like two spaces. Looking into the object further I noticed that the two are completely separate text fields. Is there a way to adjust the spacing between them, or to combine them into one text object without entirely removing the space? In the svg: <text x = '-12.5' y = '3.322266' >
<![CDATA[Q2]]>
</text>
<text x = '2' y = '3.322266' >
<![CDATA[17]]>
</text>
73% of original size (was 688x19) - Click to enlarge  |