|
Group: Forum Members
Last Active: 2 Years Ago
Posts: 33,
Visits: 76
|
In the chart I am generating the space between the Quarter and Year is more pronounced than it should be , it looks more like two spaces . Looking into the object further I noticed that the two are completely separate text fields .& nbsp ; Is there a way to adjust the spacing between them , or to combine them into one text object without entirely removing the space ? In the svg : <text x = '-12.5' y = '3.322266' >
<![CDATA[Q2]]>
</text>
<text x = '2' y = '3.322266' >
<![CDATA[17]]>
</text>
73% of original size (was 688x19) - Click to enlarge 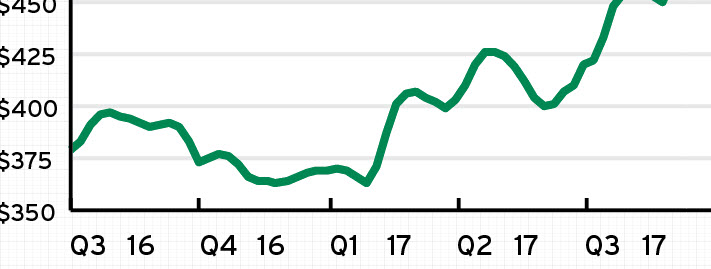
|
|
Group: Forum Members
Last Active: Last Month
Posts: 3,055,
Visits: 4,055
|
Hi Rich , Some export formats in Nevron render that way ( per word ) to minimize GDI + text measurement errors . Currently there is no way to avoid the splitting on a per word basis , but if it is badly needed we can modify this internally .
Best Regards,
Nevron Support Team
|
|
Group: Forum Members
Last Active: 2 Years Ago
Posts: 33,
Visits: 76
|
It certainly would be nice if this problem was addressed, it is magnified with certain fonts and if fonts are changed at a later point it doesnt work correctly because the space between isnt effected by a font change.
|
|
Group: Forum Members
Last Active: 2 Years Ago
Posts: 33,
Visits: 76
|
On further testing, it seems to be a side effect of the SVG format in some viewing software. It looks like Nevron is generating it all correctly, but not everyone is viewing it that way.
|


