Hi Experts,
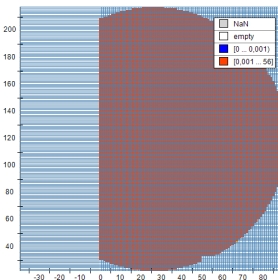
I want to display data in a NHeatMapSeries. If X and Y data is positive, it is working nice. But when I have negative X-values, only the values with positive X / Y values are displayed:
74% of original size (was 682x19) - Click to enlarge

Data is feed to the Chart like:
nevSeries.Data.SetValue(iX, iY, fValue);
when I change the Origin:
nevSeries.XValuesMode = HeatMapValuesMode.OriginAndStep;
nevSeries.OriginX = - 40; // -0.5; fXMinMax[0]
nevSeries.StepX = 1;
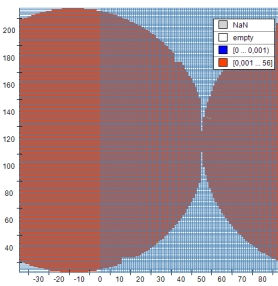
It looks like that:
74% of original size (was 682x19) - Click to enlarge

But it should look like a full circle. Are there any special settings to be made for negative X-Values ?
Thanks for the help,
Best regards,
Joern