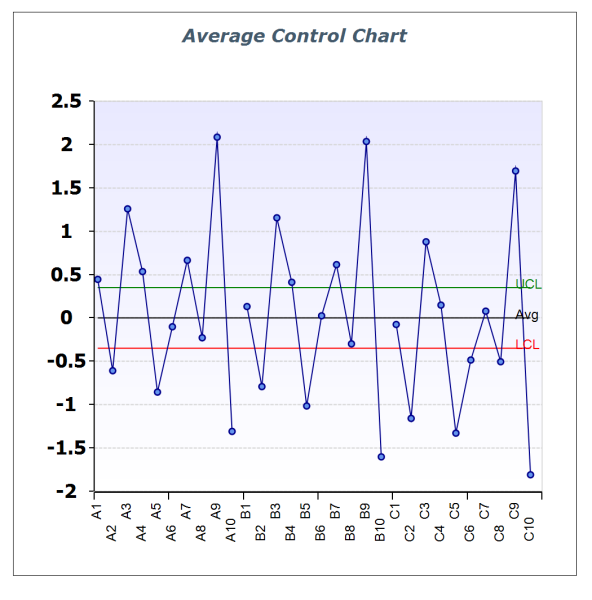
I have two methods used on my charts for setting the fonts
Most of the charts use SetupChartAxes and some use SetXAxisLabels (sorry but you have no code insert
and when I pasted the code formatting was remove). The SetXAxisLabels is set to bold and the chart below uses that
but the labels do not come out bold. Why is that?
Images
72% of original size (was 696x19) - Click to enlarge

Code
Snippetpublic virtual void SetupChartAxes ( NChart chart

{ if ( chart == null

throw new ArgumentNullException ( "chart required"

; var scaleY = new NLinearScaleConfigurator (); if ( scaleY == null

throw new NullReferenceException ( "Failed to create y axis"

; scaleY.MajorGridStyle.LineStyle.Pattern = LinePattern.Dash; scaleY.MajorGridStyle.ShowAtWalls = new ChartWallType [] { ChartWallType.Back }; scaleY.InnerMajorTickStyle.Visible = false; scaleY.LabelStyle.TextStyle.FontStyle.Style = FontStyle.Bold; scaleY.LabelStyle.TextStyle.FontStyle.EmSize = new NLength ( DefaultFontSize, NGraphicsUnit.Point

; scaleY.LabelStyle.TextStyle.FontStyle.Name = DefaultFontName; chart.Axis ( StandardAxis.PrimaryY

.ScaleConfigurator = scaleY; var scaleX = new NLinearScaleConfigurator (); if ( scaleX == null

throw new NullReferenceException ( "Failed to create x axis"

; scaleX.MajorGridStyle.LineStyle.Pattern = LinePattern.Dash; scaleX.MajorGridStyle.ShowAtWalls = new ChartWallType [] { ChartWallType.Back }; scaleX.InnerMajorTickStyle.Visible = false; scaleX.LabelStyle.TextStyle.FontStyle.Style = FontStyle.Bold; scaleX.LabelStyle.TextStyle.FontStyle.EmSize = new NLength ( DefaultFontSize, NGraphicsUnit.Point

; scaleX.LabelStyle.TextStyle.FontStyle.Name = DefaultFontName; chart.Axis ( StandardAxis.PrimaryX

.ScaleConfigurator = scaleX;} public virtual void SetXAxisLabels ( NChart chart

{ if ( chart == null

throw new ArgumentNullException ( "chart required"

; // add scale to chart // hide axis ruler, ticks and automatic labels var scaleX = new NDateTimeScaleConfigurator (); if ( scaleX == null

throw new NullReferenceException ( "Failed to create x axis"

; chart.Axis ( StandardAxis.PrimaryX

.ScaleConfigurator = scaleX; scaleX.AutoLabels = false; scaleX.UseOrigin = false; scaleX.RulerStyle.BorderStyle.Width = new NLength ( 1

; scaleX.OuterMajorTickStyle.Length = new NLength ( 5

; scaleX.InnerMajorTickStyle.Length = new NLength ( 0

; scaleX.LabelStyle.TextStyle.FontStyle.Style = FontStyle.Bold; scaleX.LabelStyle.TextStyle.FontStyle.EmSize = new NLength ( DefaultFontSize, NGraphicsUnit.Point

; scaleX.LabelStyle.TextStyle.FontStyle.Name = DefaultFontName; }