|
Group: Forum Members
Last Active: Last Year
Posts: 9,
Visits: 81
|
I have two methods used on my charts for setting the fonts
Most of the charts use SetupChartAxes and some use SetXAxisLabels (sorry but you have no code insert
and when I pasted the code formatting was remove ). The & nbsp ; SetXAxisLabels is set to bold and the chart below uses that but the labels do not come out bold . Why is that ? Images 72% of original size (was 696x19) - Click to enlarge 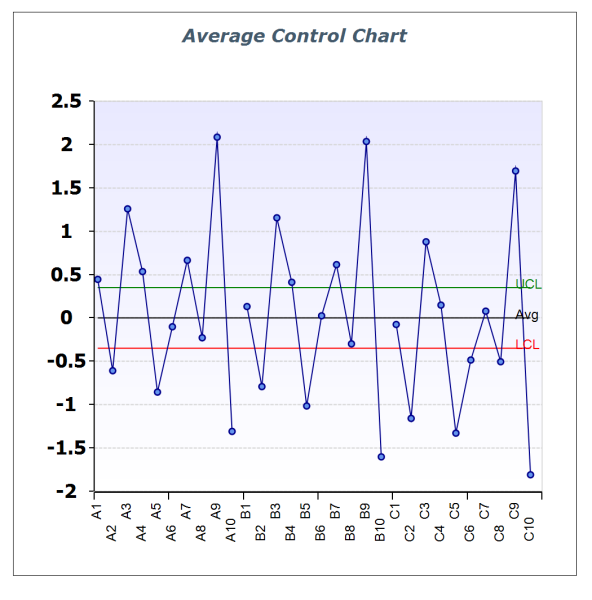 Code <span class='shl'></span>Snippetpublic & nbsp ; virtual & nbsp ; void & nbsp ; SetupChartAxes & nbsp ;(& nbsp ; NChart & nbsp ; chart & nbsp  {& nbsp ;& nbsp ;& nbsp ;& nbsp ; if & nbsp ;(& nbsp ; chart & nbsp ;==& nbsp ; null & nbsp & nbsp ;& nbsp ;& nbsp ;& nbsp ;& nbsp ;& nbsp ;& nbsp ;& nbsp ; throw & nbsp ; new & nbsp ; ArgumentNullException & nbsp ;(& nbsp ;" chart & nbsp ; required "& nbsp ; & nbsp ;& nbsp ;& nbsp ;& nbsp ; var & nbsp ; scaleY & nbsp ;=& nbsp ; new & nbsp ; NLinearScaleConfigurator & nbsp ;();& nbsp ;& nbsp ;& nbsp ;& nbsp ; if & nbsp ;(& nbsp ; scaleY & nbsp ;==& nbsp ; null & nbsp & nbsp ;& nbsp ;& nbsp ;& nbsp ;& nbsp ;& nbsp ;& nbsp ;& nbsp ; throw & nbsp ; new & nbsp ; NullReferenceException & nbsp ;(& nbsp ;" Failed & nbsp ; to & nbsp ; create & nbsp ; y & nbsp ; axis "& nbsp ; & nbsp ;& nbsp ;& nbsp ;& nbsp ; scaleY . MajorGridStyle . LineStyle . Pattern & nbsp ;=& nbsp ; LinePattern . Dash ;& nbsp ;& nbsp ;& nbsp ;& nbsp ; scaleY . MajorGridStyle . ShowAtWalls & nbsp ;=& nbsp ; new & nbsp ; ChartWallType & nbsp ;[]& nbsp ;{& nbsp ; ChartWallType . Back & nbsp ;};& nbsp ;& nbsp ;& nbsp ;& nbsp ; scaleY . InnerMajorTickStyle . Visible & nbsp ;=& nbsp ; false ; & nbsp ;& nbsp ;& nbsp ;& nbsp ; scaleY . LabelStyle . TextStyle . FontStyle . Style & nbsp ;=& nbsp ; FontStyle . Bold ;& nbsp ;& nbsp ;& nbsp ;& nbsp ; scaleY . LabelStyle . TextStyle . FontStyle . EmSize & nbsp ;=& nbsp ; new & nbsp ; NLength & nbsp ;(& nbsp ; DefaultFontSize ,& nbsp ; NGraphicsUnit . Point & nbsp ;& nbsp ;& nbsp ;& nbsp ;& nbsp ; scaleY . LabelStyle . TextStyle . FontStyle . Name & nbsp ;=& nbsp ; DefaultFontName ; & nbsp ;& nbsp ;& nbsp ;& nbsp ; chart . Axis & nbsp ;(& nbsp ; StandardAxis . PrimaryY & nbsp . ScaleConfigurator & nbsp ;=& nbsp ; scaleY ; & nbsp ;& nbsp ;& nbsp ;& nbsp ; var & nbsp ; scaleX & nbsp ;=& nbsp ; new & nbsp ; NLinearScaleConfigurator & nbsp ;();& nbsp ;& nbsp ;& nbsp ;& nbsp ; if & nbsp ;(& nbsp ; scaleX & nbsp ;==& nbsp ; null & nbsp & nbsp ;& nbsp ;& nbsp ;& nbsp ;& nbsp ;& nbsp ;& nbsp ;& nbsp ; throw & nbsp ; new & nbsp ; NullReferenceException & nbsp ;(& nbsp ;" Failed & nbsp ; to & nbsp ; create & nbsp ; x & nbsp ; axis "& nbsp ; & nbsp ;& nbsp ;& nbsp ;& nbsp ; scaleX . MajorGridStyle . LineStyle . Pattern & nbsp ;=& nbsp ; LinePattern . Dash ;& nbsp ;& nbsp ;& nbsp ;& nbsp ; scaleX . MajorGridStyle . ShowAtWalls & nbsp ;=& nbsp ; new & nbsp ; ChartWallType & nbsp ;[]& nbsp ;{& nbsp ; ChartWallType . Back & nbsp ;};& nbsp ;& nbsp ;& nbsp ;& nbsp ; scaleX . InnerMajorTickStyle . Visible & nbsp ;=& nbsp ; false ; & nbsp ;& nbsp ;& nbsp ;& nbsp ; scaleX . LabelStyle . TextStyle . FontStyle . Style & nbsp ;=& nbsp ; FontStyle . Bold ;& nbsp ;& nbsp ;& nbsp ;& nbsp ; scaleX . LabelStyle . TextStyle . FontStyle . EmSize & nbsp ;=& nbsp ; new & nbsp ; NLength & nbsp ;(& nbsp ; DefaultFontSize ,& nbsp ; NGraphicsUnit . Point & nbsp ;& nbsp ;& nbsp ;& nbsp ;& nbsp ; scaleX . LabelStyle . TextStyle . FontStyle . Name & nbsp ;=& nbsp ; DefaultFontName ; & nbsp ;& nbsp ;& nbsp ;& nbsp ; chart . Axis & nbsp ;(& nbsp ; StandardAxis . PrimaryX & nbsp . ScaleConfigurator & nbsp ;=& nbsp ; scaleX ;} public & nbsp ; virtual & nbsp ; void & nbsp ; SetXAxisLabels & nbsp ;(& nbsp ; NChart & nbsp ; chart & nbsp {& nbsp ;& nbsp ;& nbsp ;& nbsp ; if & nbsp ;(& nbsp ; chart & nbsp ;==& nbsp ; null & nbsp & nbsp ;& nbsp ;& nbsp ;& nbsp ;& nbsp ;& nbsp ;& nbsp ;& nbsp ; throw & nbsp ; new & nbsp ; ArgumentNullException & nbsp ;(& nbsp ;" chart & nbsp ; required "& nbsp ; & nbsp ;& nbsp ;& nbsp ;& nbsp ;//& nbsp ; add & nbsp ; scale & nbsp ; to & nbsp ; chart & nbsp ;& nbsp ;& nbsp ;& nbsp ;//& nbsp ; hide & nbsp ; axis & nbsp ; ruler ,& nbsp ; ticks & nbsp ; and & nbsp ; automatic & nbsp ; labels & nbsp ;& nbsp ;& nbsp ;& nbsp ; var & nbsp ; scaleX & nbsp ;=& nbsp ; new & nbsp ; NDateTimeScaleConfigurator & nbsp ;();& nbsp ;& nbsp ;& nbsp ;& nbsp ; if & nbsp ;(& nbsp ; scaleX & nbsp ;==& nbsp ; null & nbsp & nbsp ;& nbsp ;& nbsp ;& nbsp ;& nbsp ;& nbsp ;& nbsp ;& nbsp ; throw & nbsp ; new & nbsp ; NullReferenceException & nbsp ;(& nbsp ;" Failed & nbsp ; to & nbsp ; create & nbsp ; x & nbsp ; axis "& nbsp ; & nbsp ;& nbsp ;& nbsp ;& nbsp ; chart . Axis & nbsp ;(& nbsp ; StandardAxis . PrimaryX & nbsp . ScaleConfigurator & nbsp ;=& nbsp ; scaleX ; & nbsp ;& nbsp ;& nbsp ;& nbsp ; scaleX . AutoLabels & nbsp ;=& nbsp ; false ;& nbsp ;& nbsp ;& nbsp ;& nbsp ; scaleX . UseOrigin & nbsp ;=& nbsp ; false ; & nbsp ;& nbsp ;& nbsp ;& nbsp ; scaleX . RulerStyle . BorderStyle . Width & nbsp ;=& nbsp ; new & nbsp ; NLength & nbsp ;(& nbsp ; 1 & nbsp ;& nbsp ;& nbsp ;& nbsp ;& nbsp ; scaleX . OuterMajorTickStyle . Length & nbsp ;=& nbsp ; new & nbsp ; NLength & nbsp ;(& nbsp ; 5 & nbsp ;& nbsp ;& nbsp ;& nbsp ;& nbsp ; scaleX . InnerMajorTickStyle . Length & nbsp ;=& nbsp ; new & nbsp ; NLength & nbsp ;(& nbsp ; 0 & nbsp ; & nbsp ;& nbsp ;& nbsp ;& nbsp ; scaleX . LabelStyle . TextStyle . FontStyle . Style & nbsp ;=& nbsp ; FontStyle . Bold ;& nbsp ;& nbsp ;& nbsp ;& nbsp ; scaleX . LabelStyle . TextStyle . FontStyle . EmSize & nbsp ;=& nbsp ; new & nbsp ; NLength & nbsp ;(& nbsp ; DefaultFontSize ,& nbsp ; NGraphicsUnit . Point & nbsp ;& nbsp ;& nbsp ;& nbsp ;& nbsp ; scaleX . LabelStyle . TextStyle . FontStyle . Name & nbsp ;=& nbsp ; DefaultFontName ; }
|
|
Group: Forum Members
Last Active: Last Month
Posts: 3,055,
Visits: 4,055
|
Hi Devin , Please post the code with proper formatting its hard to tell what the problem is this way ...
Best Regards,
Nevron Support Team
|
|
Group: Forum Members
Last Active: Last Year
Posts: 9,
Visits: 81
|
I had this in my original message : (sorry but you have no code insert
and when I pasted the code formatting was remove).
So I guess we just hit the cancel button to not format . I thought the cancel would cancel the insert . <span class='shl'></span>Snippetpublic virtual void SetupChartAxes ( NChart chart { if ( chart == null  throw new ArgumentNullException ( "chart required" var scaleY = new NLinearScaleConfigurator (); if ( scaleY == null  throw new NullReferenceException ( "Failed to create y axis" scaleY.MajorGridStyle.LineStyle.Pattern = LinePattern.Dash; scaleY.MajorGridStyle.ShowAtWalls = new ChartWallType [] { ChartWallType.Back }; scaleY.InnerMajorTickStyle.Visible = false; scaleY.LabelStyle.TextStyle.FontStyle.Style = FontStyle.Bold; scaleY.LabelStyle.TextStyle.FontStyle.EmSize = new NLength ( DefaultFontSize, NGraphicsUnit.Point scaleY.LabelStyle.TextStyle.FontStyle.Name = DefaultFontName; chart.Axis ( StandardAxis.PrimaryY .ScaleConfigurator = scaleY; var scaleX = new NLinearScaleConfigurator (); if ( scaleX == null  throw new NullReferenceException ( "Failed to create x axis" scaleX.MajorGridStyle.LineStyle.Pattern = LinePattern.Dash; scaleX.MajorGridStyle.ShowAtWalls = new ChartWallType [] { ChartWallType.Back }; scaleX.InnerMajorTickStyle.Visible = false; scaleX.LabelStyle.TextStyle.FontStyle.Style = FontStyle.Bold; scaleX.LabelStyle.TextStyle.FontStyle.EmSize = new NLength ( DefaultFontSize, NGraphicsUnit.Point scaleX.LabelStyle.TextStyle.FontStyle.Name = DefaultFontName; chart.Axis ( StandardAxis.PrimaryX .ScaleConfigurator = scaleX;} public virtual void SetXAxisLabels ( NChart chart { if ( chart == null  throw new ArgumentNullException ( "chart required" // add scale to chart // hide axis ruler, ticks and automatic labels var scaleX = new NDateTimeScaleConfigurator (); if ( scaleX == null  throw new NullReferenceException ( "Failed to create x axis" chart.Axis ( StandardAxis.PrimaryX .ScaleConfigurator = scaleX; scaleX.AutoLabels = false; scaleX.UseOrigin = false; scaleX.RulerStyle.BorderStyle.Width = new NLength ( 1 scaleX.OuterMajorTickStyle.Length = new NLength ( 5 scaleX.InnerMajorTickStyle.Length = new NLength ( 0 scaleX.LabelStyle.TextStyle.FontStyle.Style = FontStyle.Bold; scaleX.LabelStyle.TextStyle.FontStyle.EmSize = new NLength ( DefaultFontSize, NGraphicsUnit.Point scaleX.LabelStyle.TextStyle.FontStyle.Name = DefaultFontName; } With the Cancel its just one line . Can you add a code insert to the "+ Insert ".
|
|
Group: Forum Members
Last Active: Last Year
Posts: 9,
Visits: 81
|
I have verified that the font style is not changed after the series are added to the chart but just on one chart I have different styles on the x axis : 72% of original size (was 696x19) - Click to enlarge 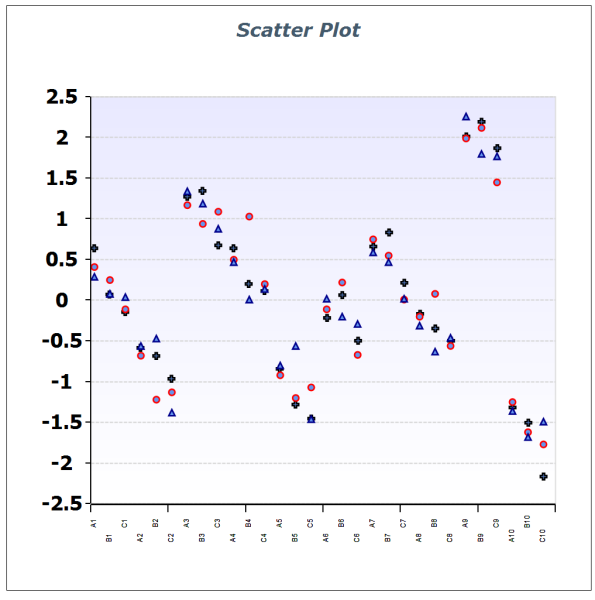 72% of original size (was 696x19) - Click to enlarge 
|
|
Group: Forum Members
Last Active: Last Month
Posts: 3,055,
Visits: 4,055
|
Hi Devin . The code that modifies the font style to bold looks ok however there may be other code that overrides the settings you have for the x axis as we tested with : private void Form1_Load ( object sender , EventArgs e ) { NChart chart = nChartControl1 . Charts [ 0 ]; chart . BoundsMode = BoundsMode . Stretch ; chart . Margins = new NMarginsL ( 10 ); chart . DockMode = PanelDockMode . Top ; chart . Size = new NSizeL ( new NLength ( 100 , NRelativeUnit . ParentPercentage ), new NLength ( 50 , NRelativeUnit . ParentPercentage )); NBarSeries bar1 = new NBarSeries (); bar1 . Values . Add ( 10 ); bar1 . Values . Add ( 20 ); bar1 . Values . Add ( 30 ); chart . Series . Add ( bar1 ); SetupChartAxes ( chart ); } public virtual void SetupChartAxes ( NChart chart ) { if ( chart == null ) throw new ArgumentNullException (" chart required "); var scaleY = new NLinearScaleConfigurator (); if ( scaleY == null ) throw new NullReferenceException (" Failed to create y axis "); scaleY . MajorGridStyle . LineStyle . Pattern = LinePattern . Dash ; scaleY . MajorGridStyle . ShowAtWalls = new ChartWallType [] { ChartWallType . Back }; scaleY . InnerMajorTickStyle . Visible = false ; scaleY . LabelStyle . TextStyle . FontStyle . Style = FontStyle . Bold ; chart . Axis ( StandardAxis . PrimaryY ). ScaleConfigurator = scaleY ; var scaleX = new NLinearScaleConfigurator (); if ( scaleX == null ) throw new NullReferenceException (" Failed to create x axis "); scaleX . MajorGridStyle . LineStyle . Pattern = LinePattern . Dash ; scaleX . MajorGridStyle . ShowAtWalls = new ChartWallType [] { ChartWallType . Back }; scaleX . InnerMajorTickStyle . Visible = false ; scaleX . LabelStyle . TextStyle . FontStyle . Style = FontStyle . Bold ; chart . Axis ( StandardAxis . PrimaryX ). ScaleConfigurator = scaleX ; } and the formatting was OK . Can you post a complete example which replicates the whole chart ? ( when posting you can first copy the code to notepad to remove any formatting and then copy the code from there ).
Best Regards,
Nevron Support Team
|
|
Group: Forum Members
Last Active: Last Month
Posts: 3,055,
Visits: 4,055
|
Hi Devin , Please post sensitive code to support@nevron.com. We are not able to see what the problem is ( as the code does not compile and does not replicate the problem ). Our guess is that the chart uses staggering + auto scaling for the x axis to resolve label overlap which occurs on the x axis - you can check if this is the case if you disable label overlap resolve using : NOrdinalScaleConfigurator scaleX = chart . Axis ( StandardAxis . PrimaryX ). ScaleConfigurator as NOrdinalScaleConfigurator ; scaleX . LabelFitModes = new LabelFitMode [ 0 ]; Hope this helps - let us know if the problem persists .
Best Regards,
Nevron Support Team
|


