I am using a line chart that uses "XValues". I want to display the specific X-axis range I want whenever data is updated. However, when I enter the data, it appears that the range is set to the value of the input data.
In my opinion, it seems that the range beyond the input value is not set.
I implemented it with reference to your sample code but it does not work.The code is shown below.
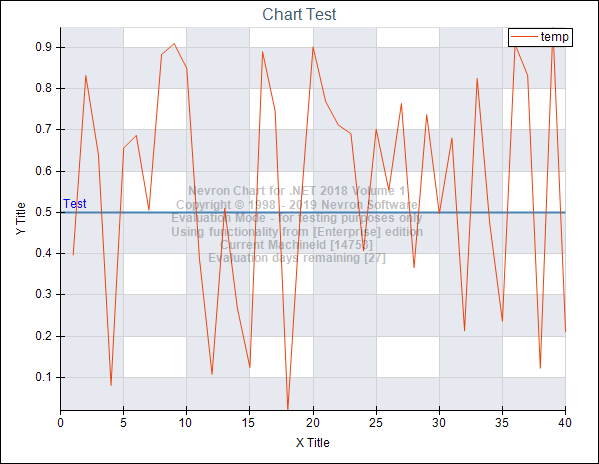
For example, in the following cases, the X axis range is set from 0 to 40 on the screen, but I want to set it from 0 to 100.
72% of original size (was 698x19) - Click to enlarge
NNumericAxisPagingView pagingView = m_chart.Axis(StandardAxis.PrimaryX).PagingView as NNumericAxisPagingView;
pagingView.Begin = xAxis.ContentRange.Begin;
pagingView.Length = 100;
//m_chart.Axis(StandardAxis.PrimaryX).PagingView.ZoomIn(new NRange1DD(xAxis.ContentRange.Begin, 100), 0.1); This also does not work
nChartControl1.Refresh();


