|
Group: Forum Members
Last Active: 5 Years Ago
Posts: 10,
Visits: 25
|
I have a NChart with a NChartControl . I added three series to this NChart : two PointSeries , one GraphicsPathSeries . After adding some line segments to GraphicsPathSeries , I tried to add some datapoints to PointSeries . But View of legend, header and axis which has been originally viewed good just disappeared . Is it impossible to hold different type of chart series in one chart ? Here is my Code :
NChart nChart = nChartControl1.Charts[0];
nChart.Axis(StandardAxis.Depth).Visible = false;

NPointSeries SeriesA = nChart.Series.Add(SeriesType.Point) as NPointSeries;
SeriesA.Size = new NLength(2, NRelativeUnit.ParentPercentage);
SeriesA.Name = "Series A";
SeriesA.PointShape = PointShape.Asterisk;
SeriesA.UseXValues = true;
SeriesA.DataLabelStyle.Visible = false;
SeriesA.FillStyle = new NColorFillStyle(Color.DarkKhaki);
SeriesA.InflateMargins = true;

NPointSeries SeriesB = nChart.Series.Add(SeriesType.Point) as NPointSeries;
SeriesB.Size = new NLength(2, NRelativeUnit.ParentPercentage);
SeriesB.Name = "Series B"
SeriesB.PointShape = PointShape.Diamond;
SeriesB.UseXValues = true;
SeriesB.DataLabelStyle.Visible = false;
SeriesB.FillStyle = new NColorFillStyle(Color.Red);
SeriesB.InflageMargins = true;

NGraphicsPathSeries SeriesC = nChart.Series.Add(SeriesType.GraphicsPath) as NGraphicsPathSeries;
SeriesC.Name = "Series C";
SeriesC.FillStyle = new NColorFillStyle(Color.DarkGray);
SeriesC.InflageMargins = true;

NAxis axisX = nChart.Axis(StandardAxis.PrimaryX);
NAxis axisY = nChart.Axis(StandardAxis.PrimaryY);
axisX.ScaleConfigurator.Title.Text = "X Axis";
axisY.ScaleConfigurator.Title.Text = "Y Axis";
axisX.ScaleConfigurator.Invert = true;
axisX.View = new NRangeAxisView(new NRange1DD(-1000.0, 1000.0), true, true);
axisY.View = new NRangeAxisView(new NRange1DD(-500, 500), true, true);

NGraphicsPath graphicsPath = new NGraphicsPath();
graphicsPath.AddLineSegment(new NPointD(2.0, 0.0), new NPointD(1.0, 1.0));
graphicsPath.AddLineSegment(new NPointD(1.0, 1.0), new NPointD(-1.5, 1.0));
graphicsPath.AddLineSegment(new NPointD(-1.5, 1.0), new NPointD(-1.5, -1.0));
graphicsPath.AddLineSegment(new NPointD(-1.5, -1.0), new NPointD(1.0, -1.0));
graphicsPath.AddLineSegment(new NPointD(1.0, -1.0), new NPointD(2.0, 0.0));
SeriesC.GraphicsPath = graphicsPath;

SeriesA.ClearDataPoints();
SeriesA.AddDataPoint(new NDataPoint(10, 10)); // This is when everything go disappear
SeriesA.AddDataPoint(new NDataPoint(20, 20));
...
...
NChart nChart = nChartControl1.Charts[0];
nChart.Axis(StandardAxis.Depth).Visible = false;
NPointSeries SeriesA = nChart.Series.Add(SeriesType.Point) as NPointSeries;
SeriesA.Size = new NLength(2, NRelativeUnit.ParentPercentage);
SeriesA.Name = "Series A";
SeriesA.PointShape = PointShape.Asterisk;
SeriesA.UseXValues = true;
SeriesA.DataLabelStyle.Visible = false;
SeriesA.FillStyle = new NColorFillStyle(Color.DarkKhaki);
SeriesA.InflateMargins = true;
NPointSeries SeriesB = nChart.Series.Add(SeriesType.Point) as NPointSeries;
SeriesB.Size = new NLength(2, NRelativeUnit.ParentPercentage);
SeriesB.Name = "Series B"
SeriesB.PointShape = PointShape.Diamond;
SeriesB.UseXValues = true;
SeriesB.DataLabelStyle.Visible = false;
SeriesB.FillStyle = new NColorFillStyle(Color.Red);
SeriesB.InflageMargins = true;
NGraphicsPathSeries SeriesC = nChart.Series.Add(SeriesType.GraphicsPath) as NGraphicsPathSeries;
SeriesC.Name = "Series C";
SeriesC.FillStyle = new NColorFillStyle(Color.DarkGray);
SeriesC.InflageMargins = true;
NAxis axisX = nChart.Axis(StandardAxis.PrimaryX);
NAxis axisY = nChart.Axis(StandardAxis.PrimaryY);
axisX.ScaleConfigurator.Title.Text = "X Axis";
axisY.ScaleConfigurator.Title.Text = "Y Axis";
axisX.ScaleConfigurator.Invert = true;
axisX.View = new NRangeAxisView(new NRange1DD(-1000.0, 1000.0), true, true);
axisY.View = new NRangeAxisView(new NRange1DD(-500, 500), true, true);
NGraphicsPath graphicsPath = new NGraphicsPath();
graphicsPath.AddLineSegment(new NPointD(2.0, 0.0), new NPointD(1.0, 1.0));
graphicsPath.AddLineSegment(new NPointD(1.0, 1.0), new NPointD(-1.5, 1.0));
graphicsPath.AddLineSegment(new NPointD(-1.5, 1.0), new NPointD(-1.5, -1.0));
graphicsPath.AddLineSegment(new NPointD(-1.5, -1.0), new NPointD(1.0, -1.0));
graphicsPath.AddLineSegment(new NPointD(1.0, -1.0), new NPointD(2.0, 0.0));
SeriesC.GraphicsPath = graphicsPath;
SeriesA.ClearDataPoints();
SeriesA.AddDataPoint(new NDataPoint(10, 10)); // This is when everything go disappear
SeriesA.AddDataPoint(new NDataPoint(20, 20));
...
...
|
|
Group: Forum Members
Last Active: Last Month
Posts: 3,055,
Visits: 4,055
|
Hi Kim , Thank you for reporting this issue - we just published a SP fixing on the website . You need to download and reinstall . NET Vision in order to use the fixed dlls . Hope we helped - let us know if you meet any problems or have any questions .
Best Regards,
Nevron Support Team
|
|
Group: Forum Members
Last Active: 5 Years Ago
Posts: 10,
Visits: 25
|
It does not seem to be fixed . Can you check it one more ? 72% of original size (was 697x19) - Click to enlarge 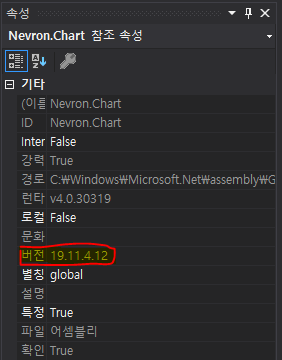 I let my VS to refer to latest version of Nevron Vision dll . but same problem occurs . 72% of original size (was 697x19) - Click to enlarge 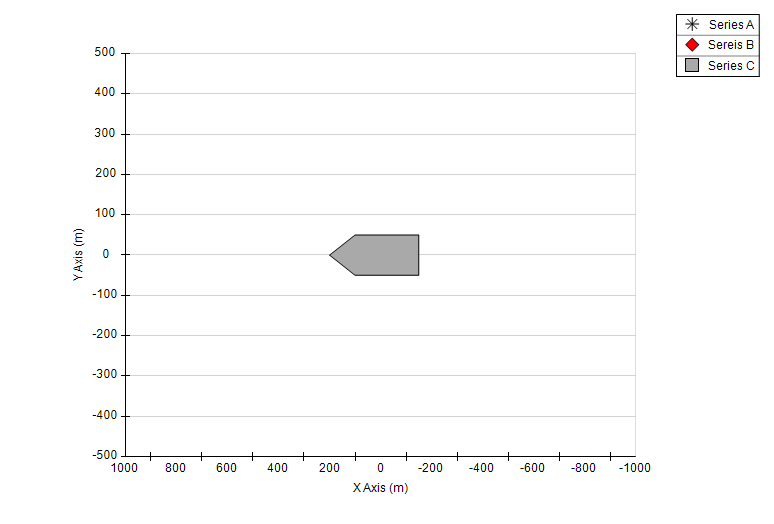 When I add datapoints to series A , 72% of original size (was 697x19) - Click to enlarge 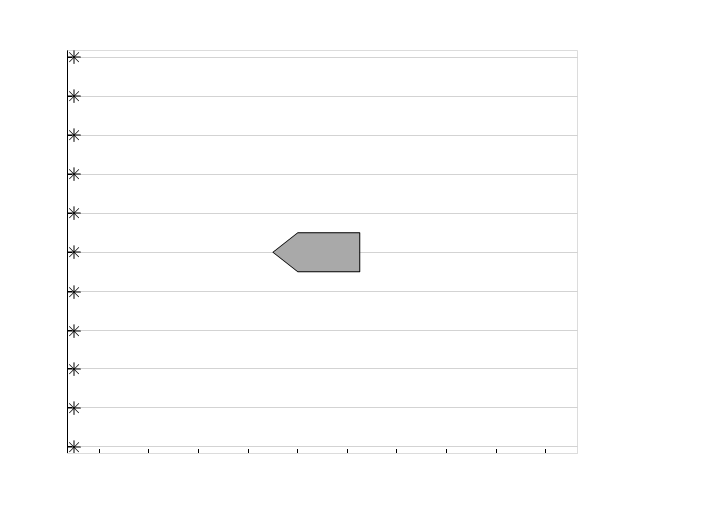
|
|
Group: Forum Members
Last Active: Last Month
Posts: 3,055,
Visits: 4,055
|
Hi Kim , Can you send us the application you ' re testing it to support@nevron.com for further review .
Best Regards,
Nevron Support Team
|
|
Group: Forum Members
Last Active: 5 Years Ago
Posts: 10,
Visits: 25
|
This problem is fixed after updating to Nevron Vision For .NET version 19.11.7.12.
Thanks ;-)
|


