|
Group: Forum Members
Last Active: 5 Years Ago
Posts: 0,
Visits: 31
|
Hello , We are using an NMeshSurfaceSeries to plot the following data . Due to the method used by Nevron to interpolate the data points we get the spikey features seen in the chart , across the diagonals of the grid . We are aware of the CellTriangulationMode option which allows to pick the diagonal used for triangulation and in this case if the other diagonal is chosen we do get a better result . However in general there is not easy way to pick the best diagonal to use . Are there any other options / interpolation methods available which may give us a better results ? E . g . a method independent of a triangulation where a weighted average of the grid values are used based on the distance to them ? 73% of original size (was 689x19) - Click to enlarge 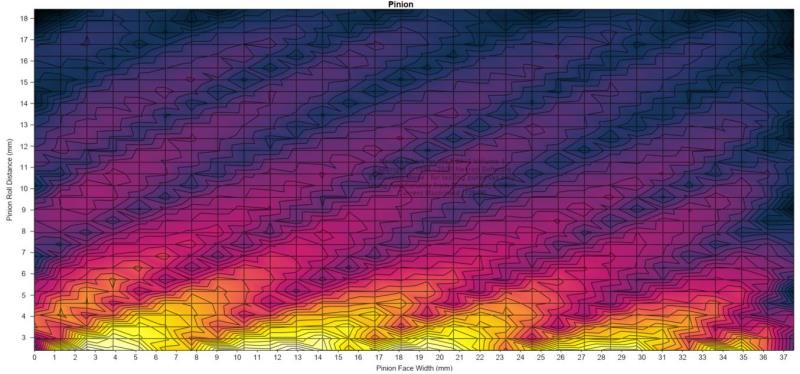
|
|
Group: Forum Members
Last Active: Last Month
Posts: 3,055,
Visits: 4,055
|
Hi Charlie , Currently , the supported options for the mesh surface triangulation are : MaxDiagonal , Diagonal1 , Diagonal2 so if you have a cell : P11 & nbsp ; P12 P21 & nbsp ; P22 Diagonal 1 pick P11 P22 and Diagonal2 P21 P12 . MaxDiagonal will pick P11 P22 or P12 P21 depending on which one has a bigger length . We can easily modify this to pick the minimum length as well or add other logic . Please send us a detailed overview of the diagonal picking logic that you have in mind for review .
Best Regards,
Nevron Support Team
|


