|
Group: Forum Members
Last Active: 4 Years Ago
Posts: 1,
Visits: 9
|
I ' m new to programming .& nbsp ; Well , object based programming and the concepts I have to get used to . What I am trying to do is basically update the graph view / axes dynamically and interactively by using NTrackBar .& nbsp ; I ' m using 4 trackbars , two per axis , that will allow the user to dynamically change the graph view .& nbsp ; These values are displayed in a textbox for the user .& nbsp ; 73% of original size (was 692x19) - Click to enlarge 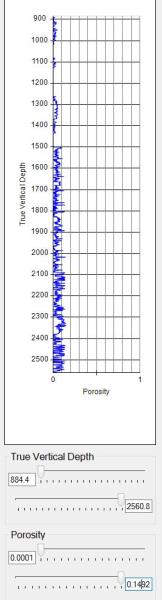 How does one dynamically update the range view using the endpoint values displayed in textboxes ?& nbsp ; Any help for this newbie would be greatly appreciated . Thanks Eyon
|
|
Group: Forum Members
Last Active: Last Month
Posts: 3,055,
Visits: 4,055
|
Hi Eyon , To specify an axis range you must change the axis view to range axis view - for exampe : N Chart chart = n ChartControl1 . Charts [ 0 ]; chart. Axis ( StandardAxis . PrimaryY ). View = new NRangeAxisView ( new NRange1DD ( 0 , 100 ), true , true ); n ChartControl1 . Refresh (); will limit the Y axis to show values in the range 0 - 100 . Is this the functionality you ' re looking for ? - or maybe you want to allow the user to also use scrolling / panning - if this is the case just let us know and we ' ll post code to accomplish this . Let us know if you have any questions or meet any problems .
Best Regards,
Nevron Support Team
|


