|
Nevron Support
|
|
|
Group: Administrators
Posts: 3.1K,
Visits: 4.2K
|
Hello Joel, There are several settings that you have to change. First, the X and Z axes should not be rounded to whole ticks:
Dim scaleX As New NLinearScaleConfigurator()
scaleX.InflateViewRangeBegin = False
scaleX.InflateViewRangeEnd = False
fChart.Axes(StandardAxis.PrimaryX).ScaleConfigurator = scaleX
Dim scaleZ As New NLinearScaleConfigurator()
scaleZ.InflateViewRangeBegin = False
scaleZ.InflateViewRangeEnd = False
fChart.Axes(StandardAxis.Depth).ScaleConfigurator = scaleZ
You also have to change the type of the fChart variable to NCartesianChart and set the Fit3DAxisContent property to False.
fChart.Fit3DAxisContent = False
Changing these setting should make the bars cover fully the pink area (you can remove the pink fill to avoid the overdraw). We tested with 2014.1 but it should be the same with 2012.1.
Best Regards,
Nevron Support Team
|
|
|
|
|
Joël Golinucci
|
|
|
Group: Forum Members
Posts: 30,
Visits: 61
|
Hi, I'm using a 3D graph because it is planned to be used along with Trackball tool. This has been removed from the demo project as the problem is not here and I've tried to simplify the code a bit. The view starts with an orthogonal top view and it's on this view that I need to have no borders, of course when the user starts turning around the graph this isn't relevant anymore. But regarding your solution, all you suggest is already present in my complete project and has no result : - I've tried to play with the BoundsMode (Fit, Strech, ... ) but it doesn't change anything.
- The "DockMode" property doesn't exists in my Nevron version, so I'm using the "Dock" property instead
- The axis are already hidden with this loop :
For Each axis As NCartesianAxis In fChart.Axes axis.Visible = False Next - And the same is done for the walls, I even set the width to 0 in addition of the visible false
For Each wall As NChartWall In fChart.Walls wall.Visible = False wall.Width = 0 Next Should I understand that I've pointed out a possible bug in the nevron 3D charts? As we are going around in circles for a while now. I'm waiting for any other proposition and I'll be glad to test them as soon as possible. Thank you for your time, Best regards, Joël
|
|
|
|
|
Nevron Support
|
|
|
Group: Administrators
Posts: 3.1K,
Visits: 4.2K
|
Hi Joel, We just reviewed the project again - why do you have to use the range series for a chart that is essentially 2D? In 2D mode it is much easier to set the chart bounds so that that they fill the area completely: NChart chart = nChartControl1.Charts[0]; chart.BoundsMode = BoundsMode.Stretch;
chart.DockMode = PanelDockMode.Fill; chart.Axis(StandardAxis.PrimaryX).Visible = false;
chart.Axis(StandardAxis.PrimaryY).Visible = false; chart.Wall(ChartWallType.Back).FillStyle = new NColorFillStyle(Color.Green); Hope this helps - let us know if you meet any problems or have any questions.
Best Regards,
Nevron Support Team
|
|
|
|
|
Joël Golinucci
|
|
|
Group: Forum Members
Posts: 30,
Visits: 61
|
Did you have any issue downloading it ? I've tried to add it directly to the post but the forum doesn't allow me to (file too big).  Also the message "an attachment is uploading..." stays after the message Anyway, please let me know directly if you have any issue downloading the file from http://www.onlineautomation.ch/jgolinuc/forum/DemoNevronChartBorderBug.zip
|
|
|
|
|
Nevron Support
|
|
|
Group: Administrators
Posts: 3.1K,
Visits: 4.2K
|
Hi Joel,
You probably forgot to attach the project...
Best Regards,
Nevron Support Team
|
|
|
|
|
Joël Golinucci
|
|
|
Group: Forum Members
Posts: 30,
Visits: 61
|
Dear support team,
Have you been able to find something from the given demo project ?
Are you experiencing the same strange results as I do ?
Thanks for your feedback.
Joël
|
|
|
|
|
Joël Golinucci
|
|
|
Group: Forum Members
Posts: 30,
Visits: 61
|
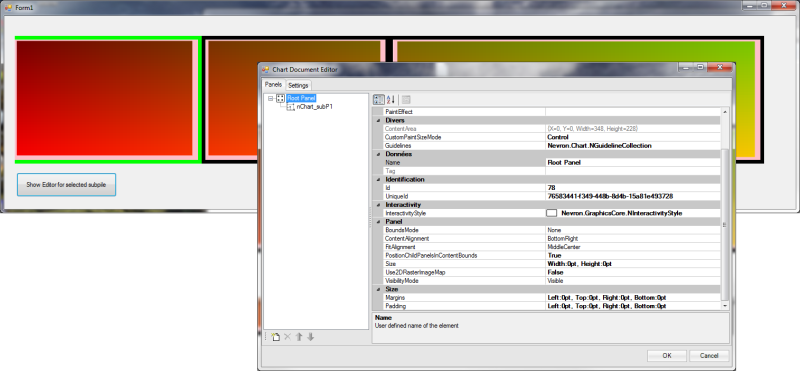
Hi, Here's a modified version of the project with a button to ShowEditor() as requested. :  You can find the project zip here : DemoNevronChartBorderBug.zipYou don't need to worry about the other classes, only look within tSubpileView.vb. The nevron objects are created in the CreateGraph() sub and the data (NRangeSerie) are added in UpdateGraphThreadPayload() on the same file. 
|
|
|
|
|
Nevron Support
|
|
|
Group: Administrators
Posts: 3.1K,
Visits: 4.2K
|
Hi Joel, Please post a more easy to comprehend example - it is hard for us to find where the chart control is actually located. For example place a button on the form and execute: someChartControl.ShowEditor() This will make it easier for us to inspect the actual chart state.
Best Regards,
Nevron Support Team
|
|
|
|
|
Joël Golinucci
|
|
|
Group: Forum Members
Posts: 30,
Visits: 61
|
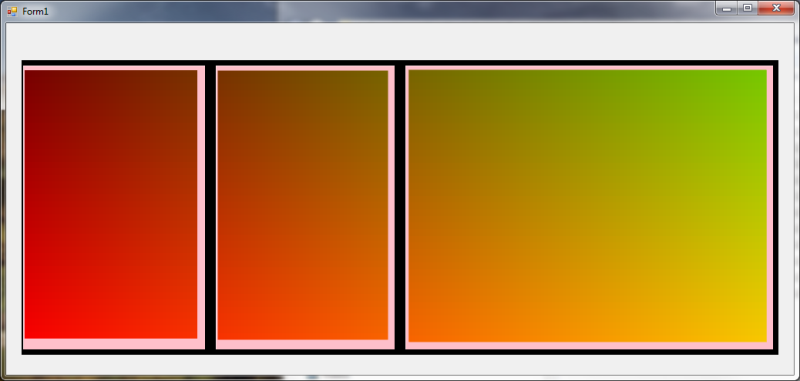
Hello, Sorry to continue this thread only 3 months later (I was stuck on other parts of the project, but I finally managed to find some time to create this demo project). You will find a very simplified use of the classes needed for the graph display, where the data is hard coded. All the usefull code for graphs can be found in DemoNevronChartBorderBug\GrpahPanel\ tSubpileView.vb. More specifically in the CreateGraph() sub for the graph creation, and on the UpdateGraphThreadPayload() sub for the data (rangeSeries) update.  To sum up the question: How can I get rid of these pink borders ?
I would like to have the NRangeSeries fit the NChart object, itself filling the NChartControl completely. Many thanks for your help ! Best regards, Joël Golinucci
|
|
|
|
|
Nevron Support
|
|
|
Group: Administrators
Posts: 3.1K,
Visits: 4.2K
|
Hi Joel, Can you post a small project to our support replicating this problem - it can be a number of things like padding, margins, pixel rounding etc...
Best Regards,
Nevron Support Team
|
|
|
|