Hello,
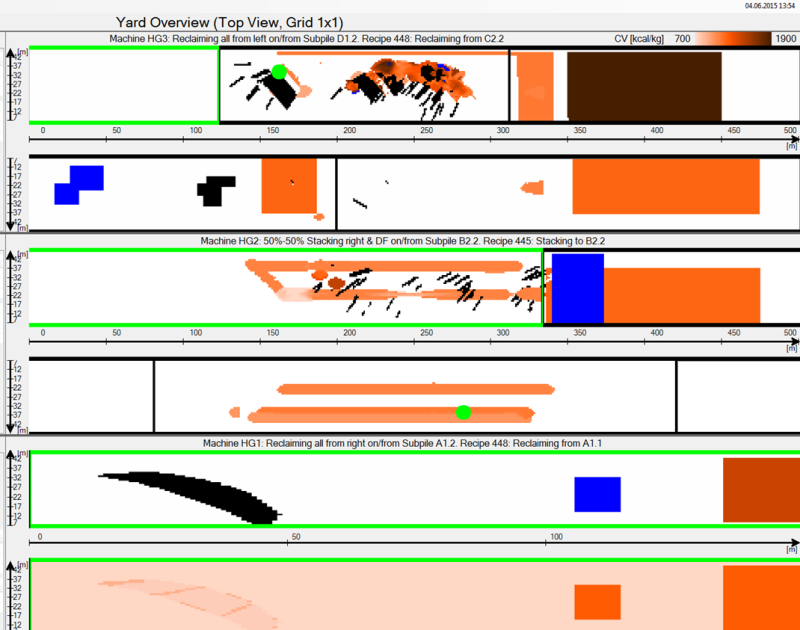
I'm using sevral Nevron Charts on a Windows form to display stock of coal and here is a representation of when it works:
73% of original size (was 688x19) - Click to enlarge

The images arent really pretty because they contain lots of tests but for the purpose of this explaination it is good enough.
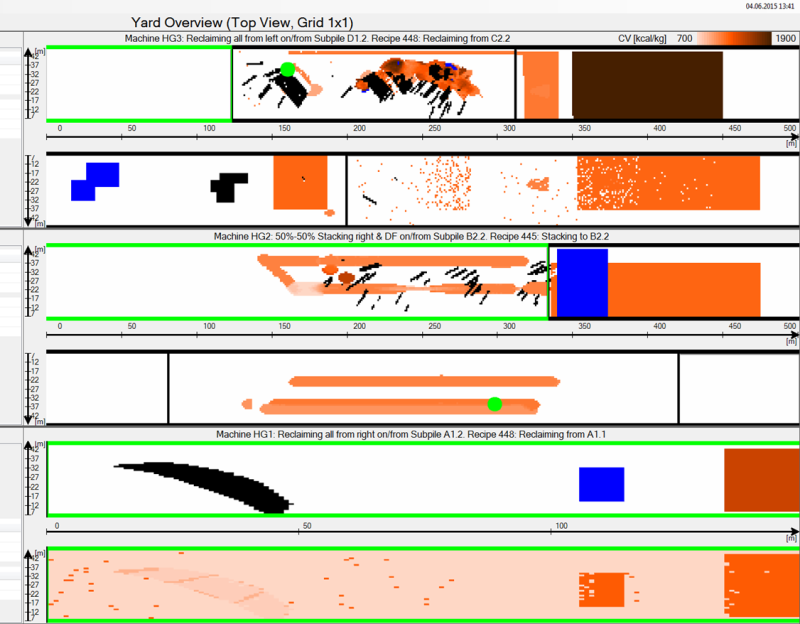
Every once and a while I refresh some of thoses graphs and for every graph refreshed I sometimes have something like that:
73% of original size (was 688x19) - Click to enlarge

Lots of misplaced points around the graph for no apparent reason.
Here is the code I use for refreshing (executed in separate threads, one for each graph):
If fRangeSeries IsNot Nothing Then
Dim ptList As List(Of tGraphPoint) = fDataStorage.GetCells(fSubPile, fCurrentPlotVariable, layer, grid, fLastUpdateDate)
If ptList IsNot Nothing AndAlso ptList.Count > 0 Then fCurrentPointList = ptList
If ptList IsNot Nothing AndAlso ptList.Count > 0 Then
fChartControl.SuspendLayout()
'If its a full refresh, we clear all points before because we might have changed the grid and receive less points as before
If fLastUpdateDate = DateTime.MinValue Then
fRangeSeries.Values.Clear()
fRangeSeries.Y2Values.Clear()
fRangeSeries.XValues.Clear()
fRangeSeries.X2Values.Clear()
fRangeSeries.ZValues.Clear()
fRangeSeries.Z2Values.Clear()
End If
fLastUpdateDate = Now()
For i As Integer = 0 To ptList.Count - 1
Dim pt As tGraphPoint = ptList(i)
'Nevron Y start - Depth (Z axis)
If fRangeSeries.Values.Count > i Then
fRangeSeries.Values(i) = pt.Z
Else
fRangeSeries.Values.Add(pt.Z)
End If
'Nevron Y end
If fRangeSeries.Y2Values.Count > i Then
fRangeSeries.Y2Values(i) = pt.Z + CDbl(fDataStorage.CellDimZ.Value)
Else
fRangeSeries.Y2Values.Add(pt.Z + CDbl(fDataStorage.CellDimZ.Value))
End If
'Nevron X start - Horizontal (X axis)
If fRangeSeries.XValues.Count > i Then
fRangeSeries.XValues(i) = pt.X
Else
fRangeSeries.XValues.Add(pt.X)
End If
'Nevron X end
If fRangeSeries.X2Values.Count > i Then
fRangeSeries.X2Values(i) = pt.X + CDbl(fDataStorage.CellDimX.Value) * grid.X
Else
fRangeSeries.X2Values.Add(pt.X + CDbl(fDataStorage.CellDimX.Value) * grid.X)
End If
'Nevron Z start - Vertical (Y axis)
If fRangeSeries.ZValues.Count > i Then
fRangeSeries.ZValues(i) = pt.Y
Else
fRangeSeries.ZValues.Add(pt.Y)
End If
'Nevron Z end
If fRangeSeries.Z2Values.Count > i Then
fRangeSeries.Z2Values(i) = pt.Y + CDbl(fDataStorage.CellDimY.Value) * grid.Y
Else
fRangeSeries.Z2Values.Add(pt.Y + CDbl(fDataStorage.CellDimY.Value) * grid.Y)
End If
'Quality value (color of the point)
If fRangeSeries.FillStyles.Count > i Then
Dim colorFill As NColorFillStyle = fRangeSeries.FillStyles(i)
If colorFill IsNot Nothing Then colorFill.Color = fDataStorage.GetColorFromValue(fCurrentPlotVariable, pt.Value, pt.NaLimit)
Else
fRangeSeries.FillStyles.Add(i, New NColorFillStyle(fDataStorage.GetColorFromValue(fCurrentPlotVariable, pt.Value, pt.NaLimit)))
End If
Next
End If
End If
fChartControl.ResumeLayout()
fChartControl.Refresh()Here is the type of the diffrent variable used:
Protected fChartControl As NChartControl
Protected fChart As NCartesianChart
Protected fRangeSeries As NRangeSeriesThe series is created like this:
fRangeSeries = New NRangeSeries()
fRangeSeries.Name = String.Format("nRangeSeries_{0}", fSubPile.ToString())
fRangeSeries.InflateMargins = False
fRangeSeries.DataLabelStyle.Visible = False
fRangeSeries.Legend.Mode = SeriesLegendMode.None
fRangeSeries.BorderStyle.Width = New NLength(0)
fRangeSeries.UseXValues = True fRangeSeries.UseZValues = True
fRangeSeries.Shape = BarShape.Bar
Thank you very much for any help provided on this issue.
Best regards,
Joël