Hi
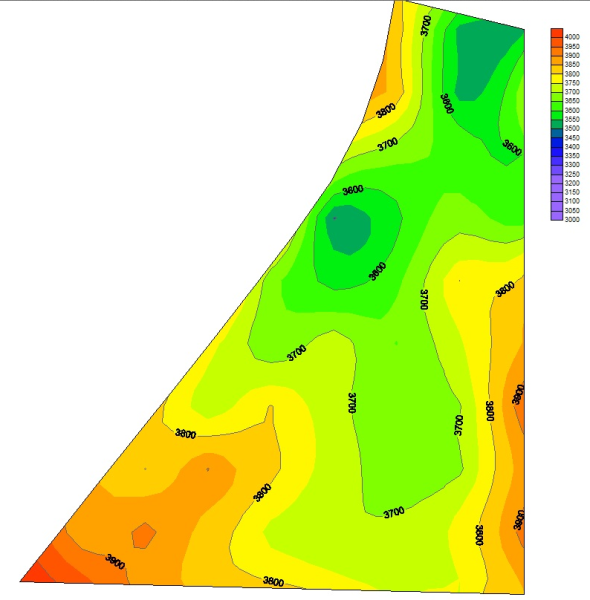
My company is developing a c# software to analyze material density information. At the end of the math we need to show the results as an heatmap chart with contour lines.
We would like to show the values on the contour lines (see example below). Can we do it using the Nevron Chart libraries?
