|
Group: Forum Members
Last Active: 8 Years Ago
Posts: 17,
Visits: 79
|
That was too easy! I wish the online documentation said "How to obtain 2 or 3 line labels" on your charts. In the expression editor for Data Labels, press enter and add a second line. I looked everywhere in the online documentation. Off and running, thanks!
|
|
Group: Forum Members
Last Active: 7 hours ago
Posts: 3,055,
Visits: 4,052
|
Hi Steve, We are glad that we were able to help. To have the labels on two, or multiple lines, you simply need to break the line in the expression editor like this: =IF(FIRST(Fields!Total_Current_Charges)<20, "Less than 20 OMR",
IF(FIRST(Fields!Total_Current_Charges)>35, "Greater than 35 OMR", "Between 20 and 35 OMR")) + "
" +
FORMAT(SUM(Fields!Total_Current_Charges), "N0", "en-us") + "
" +
FORMAT((SUM(Fields!Total_Current_Charges)/SUM(Parent.Fields!Total_Current_Charges)), "P0", "en-us")
Best Regards,
Nevron Support Team
|
|
Group: Forum Members
Last Active: 8 Years Ago
Posts: 17,
Visits: 79
|
Good news! Chart is working properly. Still don't know how to make the Labels appear on two lines. Many thanks for your help. You guys are awesome! 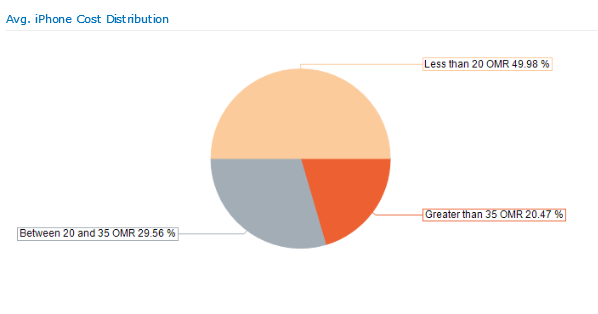
|
|
Group: Forum Members
Last Active: 7 hours ago
Posts: 3,055,
Visits: 4,052
|
Hello Steve, Thank you for providing the sample data. Following is the resulting Pie chart: 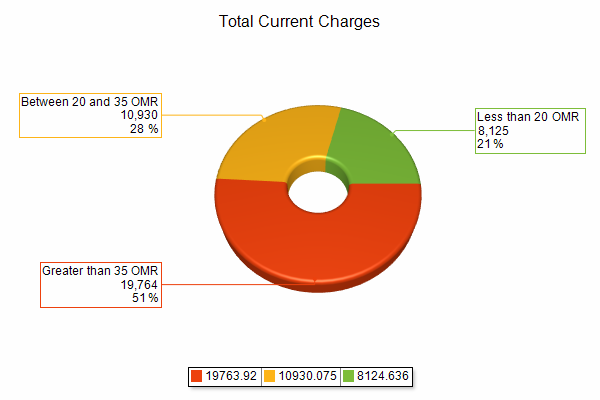 Attached, you can also find the chart template file. Let us know if you have any questions or if you need assistance.
Best Regards,
Nevron Support Team
|
|
Group: Forum Members
Last Active: 8 Years Ago
Posts: 17,
Visits: 79
|
Attached is Jan/Feb data from Sharepoint list. When creating a chart, I set a filter for Iphone charges. Thanks for the helping hand(mind)!
|
|
Group: Forum Members
Last Active: 7 hours ago
Posts: 3,055,
Visits: 4,052
|
Steve, Can you send a snapshot of your data (in Excel spreadsheet). We are going to prepare an example for you.
Best Regards,
Nevron Support Team
|
|
Group: Forum Members
Last Active: 8 Years Ago
Posts: 17,
Visits: 79
|
 I am still not able to pass labels to the Label: or the Legend. Expression appears to work correctly as the percentages are correct. Below is the expression and a picture of the chart. 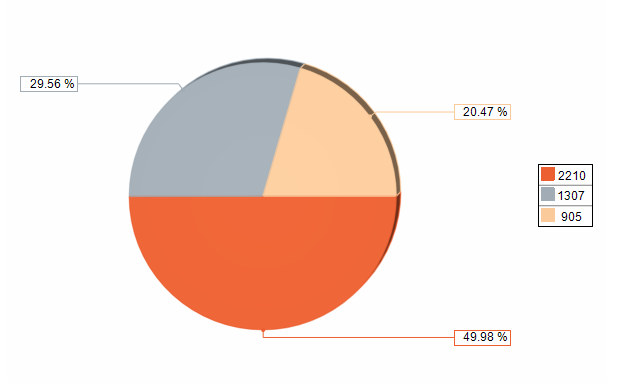
|
|
Group: Forum Members
Last Active: 8 Years Ago
Posts: 17,
Visits: 79
|
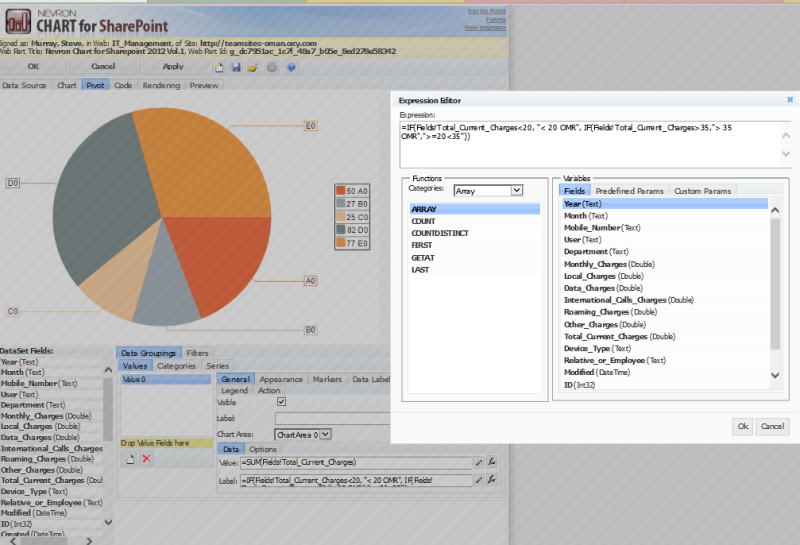 Still no joy yet.... This seems to be a pretty straight forward chart; however, I am unable to "pass" the filter criteria labels to either the Legend or the pie chart Data Labels. Copy of chart w/o labels and logic. 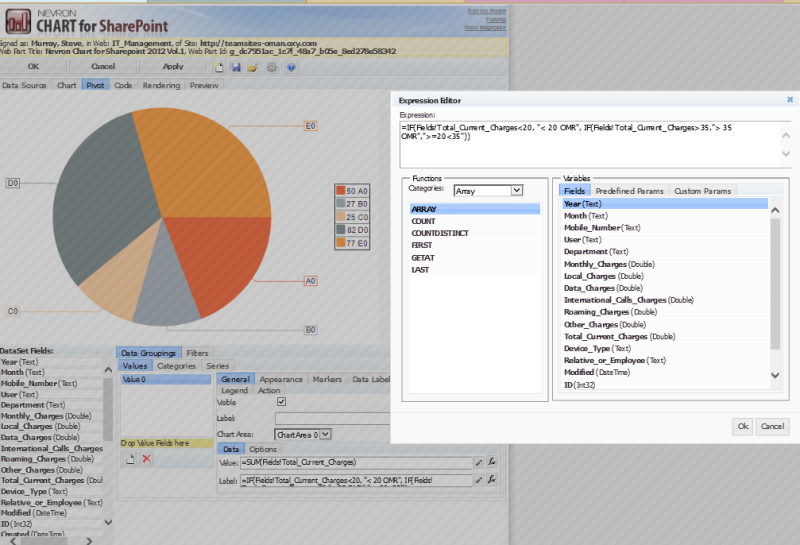
|
|
Group: Forum Members
Last Active: 8 Years Ago
Posts: 17,
Visits: 79
|
 No joy yet. Attached is the requested information. 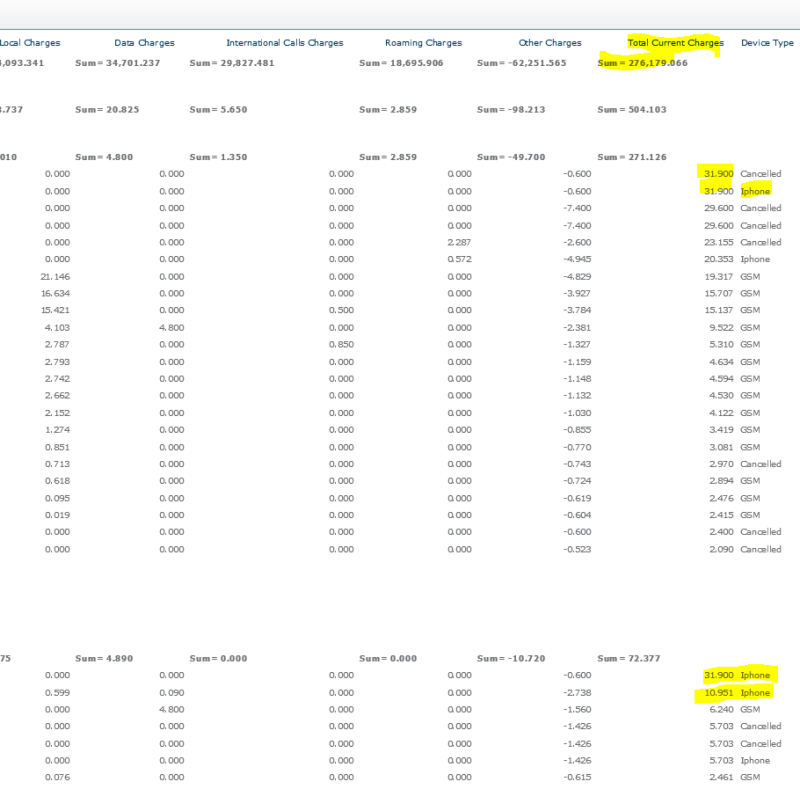
|
|
Group: Forum Members
Last Active: 8 Years Ago
Posts: 17,
Visits: 79
|
Thanks.... I tried your "First" suggestion.... no joy. I have attached a snapshot and a copy of November's data (minus cell number, department, name.) Appreciate your help. 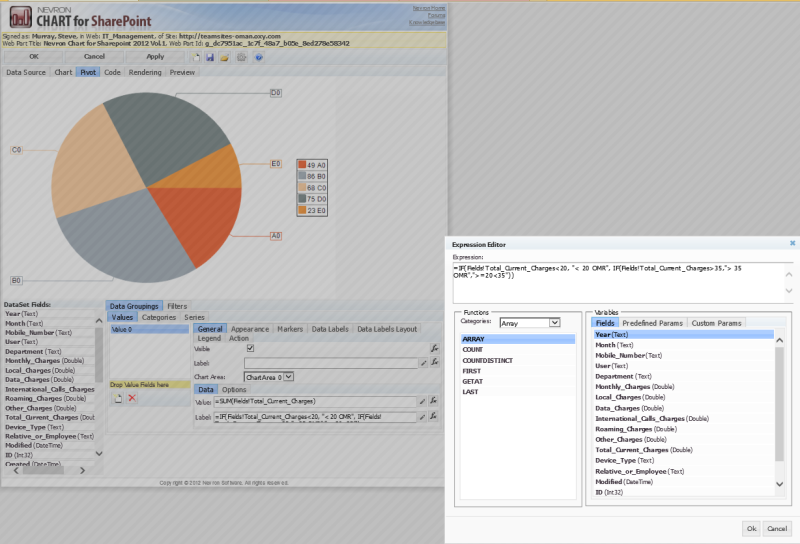
|