|
Group: Forum Members
Last Active: Last Year
Posts: 11,
Visits: 64
|
For a grid surface chart, is there a way to limit the legend range to be the range of the Y-axis (not the data)? For example, this looks pretty weird. It looks even worse when the data has outliers. 73% of original size (was 691x19) - Click to enlarge 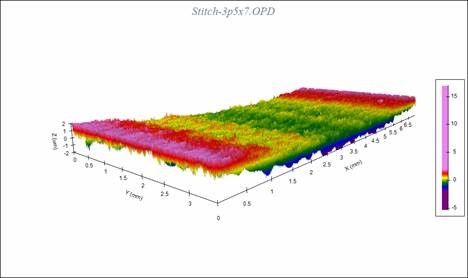 |


