Profile Picture

X-axis dates with inconsistent time-intervals

Posted By Vahid Mesri 8 Years Ago

X-axis dates with inconsistent time-intervals

Author
Message
Vahid Mesri
Problem Posted 8 Years Ago
View Quick Profile
Forum Newbie

Forum Newbie (4 reputation)Forum Newbie (4 reputation)Forum Newbie (4 reputation)Forum Newbie (4 reputation)Forum Newbie (4 reputation)Forum Newbie (4 reputation)Forum Newbie (4 reputation)Forum Newbie (4 reputation)Forum Newbie (4 reputation)

Group: Forum Members
Last Active: 3 Years Ago
Posts: 11, Visits: 67
Hi,

In my smooth-line plot, the x-values are dates and the y-values are percentages.
The issue is that I have monthly values at the beginning section of my plot, however, after two years, the dates are updated on yearly basis, therefore the dates do not have consistent intervals.

Please find attached the plot I've created using the Microsoft chart control. I would like to use Nevron to reproduce this plot but unfortunately it treats the dates as categories and not datetime variables.

Thanks a lot for your help Smile

 
72% of original size (was 697x19) - Click to enlarge
https://www.nevron.com/forum/uploads/images/d3035e64-c2a9-4868-96e6-197d.png


Reply
Vahid Mesri
Posted 8 Years Ago
View Quick Profile
Forum Newbie

Forum Newbie (4 reputation)Forum Newbie (4 reputation)Forum Newbie (4 reputation)Forum Newbie (4 reputation)Forum Newbie (4 reputation)Forum Newbie (4 reputation)Forum Newbie (4 reputation)Forum Newbie (4 reputation)Forum Newbie (4 reputation)

Group: Forum Members
Last Active: 3 Years Ago
Posts: 11, Visits: 67
Thanks a lot for your reply. Indeed, changing the plot sub type to XY scatter did solve my problem, however, no I'm experiencing a new issue with x-axis labels. 
72% of original size (was 697x19) - Click to enlarge
https://www.nevron.com/forum/uploads/images/ffa3172c-a3de-41e3-ab44-daf0.png


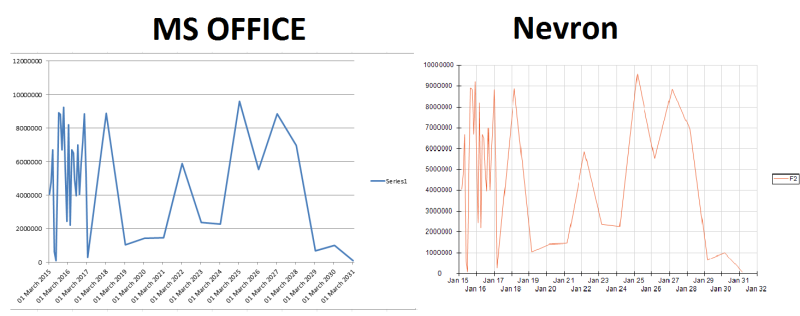
I would like to reproduce the plot on the left-side using Nevron
The issue is that the x-axis in my data (testData.csv) consists of dates commencing from March 2015 but Nevron selects Jan 2015 when generating the labels automatically. Please note that the time-differences between the dates are not equal.

Even when I set the x-axis scale to have custom steps  and set the start range of my plot to March 2015, the generated lables in Nevron begin from January 2015 (and not March).

Thanks alot
p.s. I've attached the csv and rdl. to replicate, please remove the ".txt" extension and copy the csv file to "c:\rep"


Attachments
testData.csv.txt (664 views, 899 bytes)
testNevron.rdl.txt (627 views, 16.00 KB)


Similar Topics


Reading This Topic

1 active, 1 guest, 0 members, 0 anonymous.
No members currently viewing this topic!