|
Group: Forum Members
Last Active: Last Month
Posts: 3,055,
Visits: 4,055
|
Hello Steve, Thank you for providing the sample data. Following is the resulting Pie chart: 73% of original size (was 693x19) - Click to enlarge 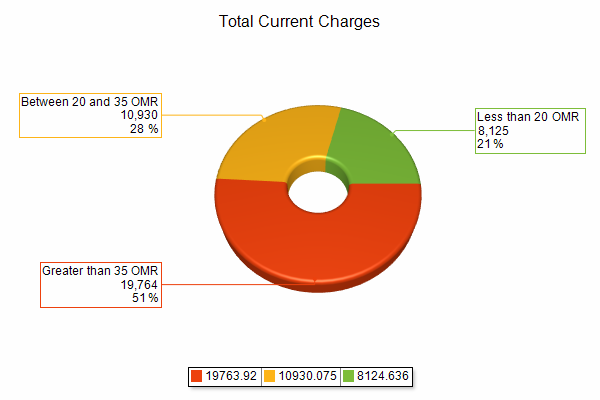 Attached, you can also find the chart template file. Let us know if you have any questions or if you need assistance.
Best Regards,
Nevron Support Team
|
|
Group: Forum Members
Last Active: 8 Years Ago
Posts: 17,
Visits: 79
|
Good news! Chart is working properly. Still don't know how to make the Labels appear on two lines. Many thanks for your help. You guys are awesome! 73% of original size (was 693x19) - Click to enlarge  |
|
Group: Forum Members
Last Active: Last Month
Posts: 3,055,
Visits: 4,055
|
Hi Steve, We are glad that we were able to help. To have the labels on two, or multiple lines, you simply need to break the line in the expression editor like this: =IF(FIRST(Fields!Total_Current_Charges)<20, "Less than 20 OMR",
IF(FIRST(Fields!Total_Current_Charges)>35, "Greater than 35 OMR", "Between 20 and 35 OMR")) + "
" +
FORMAT(SUM(Fields!Total_Current_Charges), "N0", "en-us") + "
" +
FORMAT((SUM(Fields!Total_Current_Charges)/SUM(Parent.Fields!Total_Current_Charges)), "P0", "en-us")
Best Regards,
Nevron Support Team
|
|
Group: Forum Members
Last Active: 8 Years Ago
Posts: 17,
Visits: 79
|
That was too easy! I wish the online documentation said "How to obtain 2 or 3 line labels" on your charts. In the expression editor for Data Labels, press enter and add a second line. I looked everywhere in the online documentation. Off and running, thanks!
|


