Bar series are used to display data ranges, where each range has variable end point and all ranges in the series originate from a common starting value, called
the origin value. This value is typically 0 but can be configured to be any arbitrary value. There are many different variations of the bar chart that differ by the
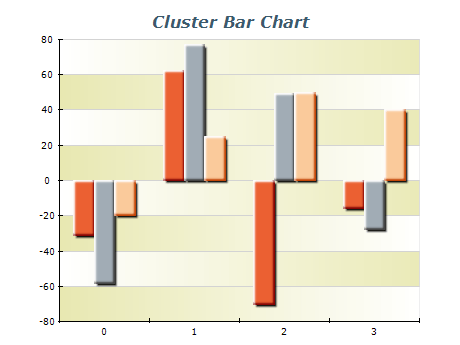
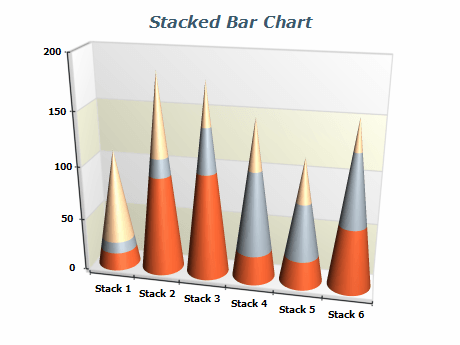
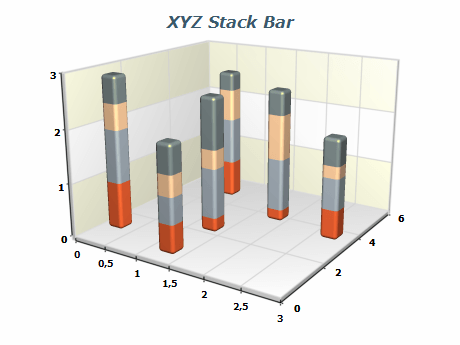
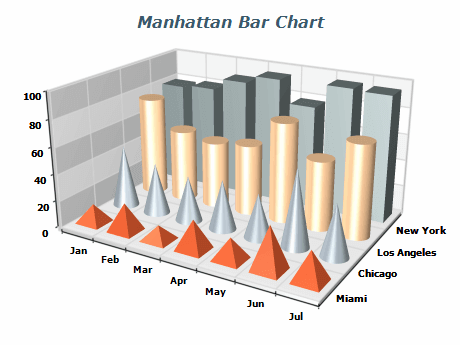
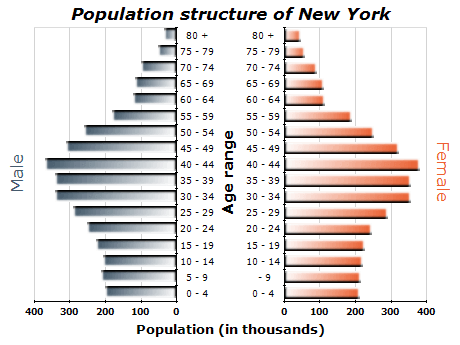
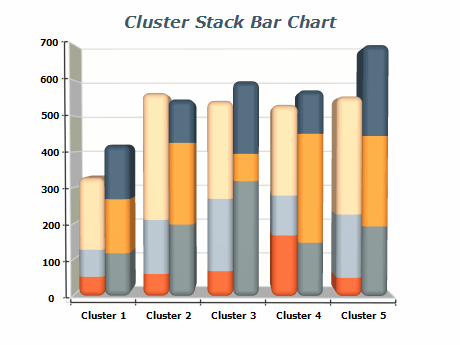
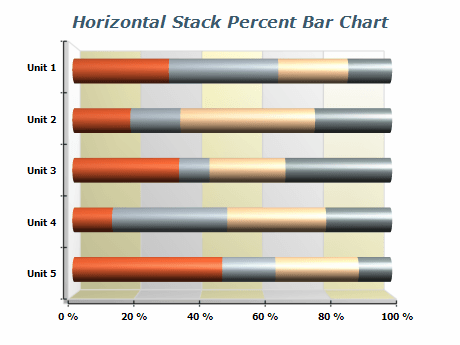
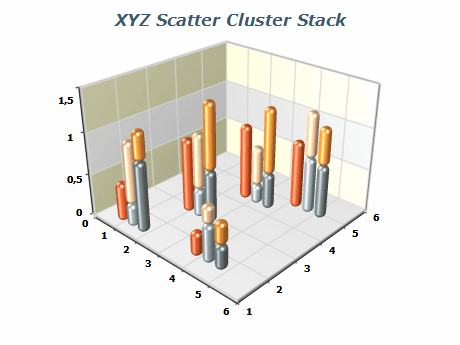
number of values supplied to the chart (for example XY scatter bars), the way bar series are grouped (for example stacked, stacked percent, and clustered bar charts),
and the orientation of the bars – for example, horizontal bar chart.