|
Group: Forum Members
Last Active: Last Year
Posts: 86,
Visits: 221
|
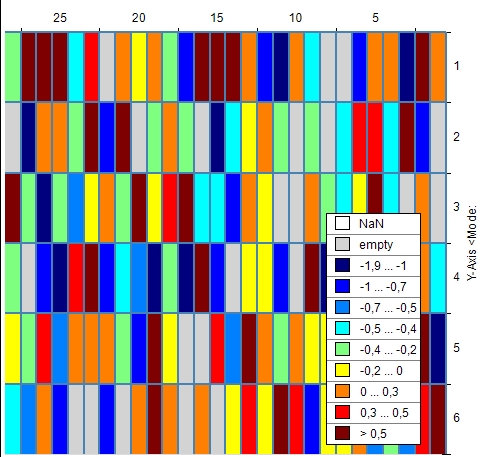
Hi Experts, I have a HeatMapChart like the following: 73% of original size (was 688x19) - Click to enlarge  now I want to show a label with the X and Y and the according values when the Mouse hovers over the chart. Is there an easy way to do so? I tried it with an NRectangularCallout together with a new Controller: [Serializable]
public class MyDataLabelTool : NTool {
#region Constructor
public MyDataLabelTool() {
}
#endregion
#region Overrides
public override void OnMouseMove(object sender, Nevron.Chart.Windows.NMouseEventArgs e) {
NControlView view = (NControlView)this.GetView();
NHitTestCacheService hitTestService = GetView().GetServiceOfType(typeof(NHitTestCacheService)) as NHitTestCacheService;
if (hitTestService == null) return;
NHitTestResult result = new NHitTestResult(hitTestService.HitTest(new NPointF(e.X, e.Y)) as NChartNode);
INMouseService mouseService = (INMouseService)GetView().GetServiceOfType(typeof(INMouseService));
if (result.ChartElement == ChartElement.DataPoint) {
mouseService.Cursor = Cursors.SizeAll;
int fX = result.HeatMapDataPointX;
int fY = result.HeatMapDataPointY;
int iIndex = result.DataPointIndex;
double fValue = ((NHeatMapSeries)(result.Chart.Series[0])).Data.Values[iIndex];
Console.WriteLine("Index: " + iIndex.ToString() + " X:" + fX.ToString() + " Y:" + fY.ToString() + " Value: " + fValue.ToString("N2"));
// up to here it is working => on the output window the correct values are displayed
NRectangularCallout m_RectangularCallout = (NRectangularCallout)result.Chart.Series[0].Tag;
NDataPointAnchor anchor = new NDataPointAnchor(result.Chart.Series[0], iIndex, ContentAlignment.MiddleCenter, StringAlignment.Center);
m_RectangularCallout.Anchor = anchor; // anchor still has no series at this point (series==null)
m_RectangularCallout.Text = " X:" + fX.ToString() + " Y:" + fY.ToString() + " Value: " + fValue.ToString("N2");
m_RectangularCallout.Visible = true;
// no error here - but also no Label
}
else {
mouseService.Cursor = mouseService.DefaultCursor;
}
}
#endregionThe Controller itself seems to get the correct values when the mouse is moved - but the anchor point seems to be wrong. After doing: NDataPointAnchor anchor = new NDataPointAnchor(result.Chart.Series[0], iIndex, ContentAlignment.MiddleCenter, StringAlignment.Center);the anchor.Series is still null - and no Label is shown.
Thanks for helping, Best regards, Joern
|
|
Group: Forum Members
Last Active: Last Month
Posts: 3,055,
Visits: 4,055
|
Hi Joern,
The heat map series does not support expose anchor coordinates for the callout - you may need to use a different type of anchor - for example axs scale point anchor - check out the Panels \ Annotations \ General example on how to create such an anchor. Let us know if you meet any problems or have any questions.
Best Regards,
Nevron Support Team
|
|
Group: Forum Members
Last Active: Last Year
Posts: 86,
Visits: 221
|
... thanks for the hint - now I got it working:
m_RectangularCallout.Anchor = new NScalePointAnchor(nChartControl1.Charts[0],
(int)StandardAxis.PrimaryX,
(int)StandardAxis.PrimaryY,
(int)StandardAxis.Depth,
AxisValueAnchorMode.Clip, new NVector3DD(1, 2, 0));
Best regards,
Joern
|