|
Group: Forum Members
Last Active: 8 Years Ago
Posts: 2,
Visits: 21
|
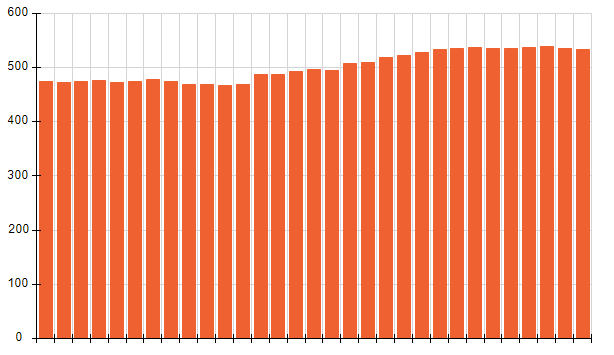
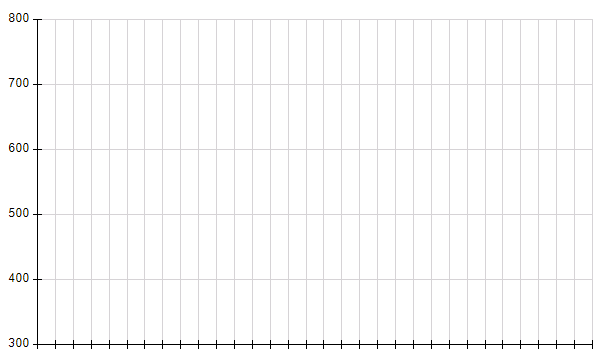
Hi, Currently, I am using Nevron for SSRS 2012. I have a problem setting the y-axis range for bar chart. When the range is not set, the chart are displaying fine.  When the range is set, the chart disappear. 72% of original size (was 700x201) - Click to enlarge   Regards, Shao Wei
|
|
Group: Forum Members
Last Active: Last Month
Posts: 3,055,
Visits: 4,055
|
Hi Shao, We just tested the most recent version of the control and were not able to replicate a problem with the axis range. Please check whether you experience the problem with the most recent release.
Best Regards,
Nevron Support Team
|
|
Group: Forum Members
Last Active: 8 Years Ago
Posts: 2,
Visits: 21
|
Hi,
Thanks for the reply.
I have tested in 2016.1 version and it is working fine. But currently, I am working with 2014.1 version for sql 2012 and ssdt/vs 2010. Is this function working in version 2014.1?
Regards,
Shao Wei
|
|
Group: Forum Members
Last Active: Last Month
Posts: 3,055,
Visits: 4,055
|
Hi Shao, It appears that the feature is working in the 2014.1 release as well...
Best Regards,
Nevron Support Team
|