Hi Experts,
I tried to rebuild the given Example for a ThinWeb-Chart with Zoom functionality from the scratch in the following way:
1. VS2015 - New Project WebForms with WebApi and MVC checked (not that I need the functionality right now but just to make sure that I am not missing something later).
2. Add the ThinWebClient Chart to the WebForm together with the necessary Nevron-dlls
3. Add the given Code from the Example to the Page_Load
(Nevron .NetVision 2016.1 for VS2015 => Nevron Chart - WebForm - Solution C# => Contents => ThinWeb => Data Zoom Tool => Source Code)
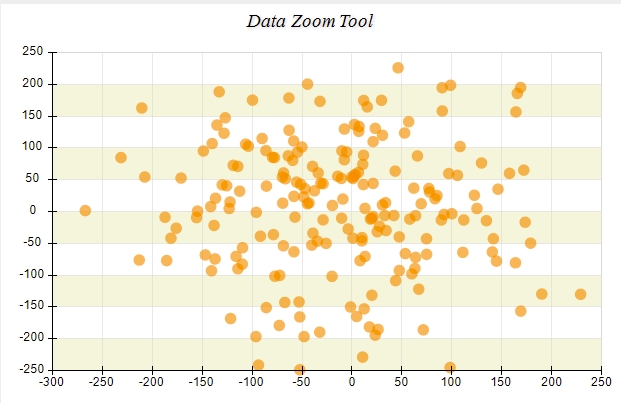
4. Running this example -> initially it looks good - exactly like the given example
73% of original size (was 687x19) - Click to enlarge

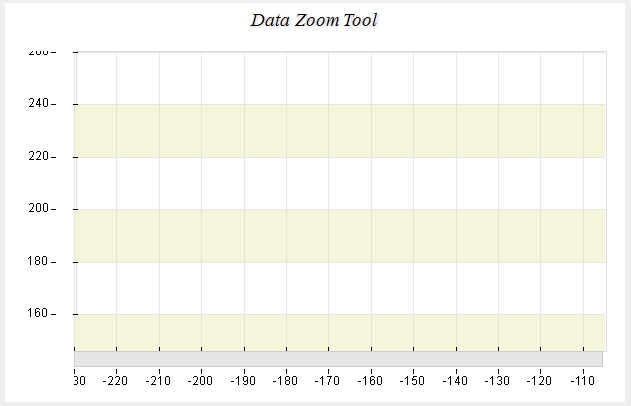
But when I try to use the zoom, it looks not so good anymore - mostly there are no data points at all , although there should be some. Furthermore, the scrollbars at the axis are only half way there (well, not even half-way since the X-Axis scrollbar can not be scrolled):
73% of original size (was 687x19) - Click to enlarge

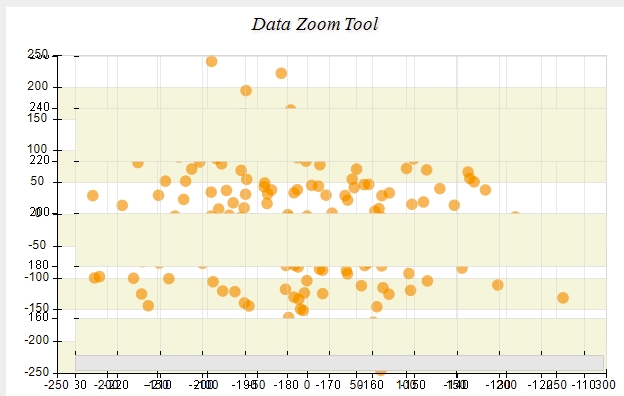
when I zoom out again, only some of the data points are back and now the axis seem to have a problem too:
73% of original size (was 687x19) - Click to enlarge

What am I missing here - it seems like some sort of Refresh or RePaint command should be done? When I just run the complete C# Nevron Example, everything is working well.
Thanks for your help,
best regards,
Joern