|
Group: Forum Members
Last Active: 6 Years Ago
Posts: 2,
Visits: 21
|
Hi all , We are having an issue trying to create a line graph with Dates along the X Axis using Numerical instead of Categorical . When using Categorical it all works ok but when trying to render as Numerical we get the following & nbsp ; 73% of original size (was 693x19) - Click to enlarge 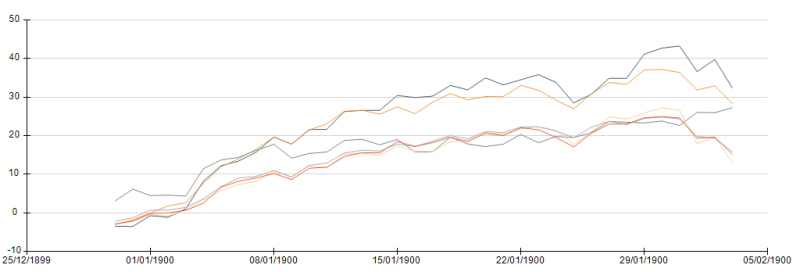 These dates should be from Jan 2016 - August 2018 and not 1900 as the graph shows . We have tried passing data through in a number of formats ( yyyy - MM - dd , dd / MM / YYYY , including and excluding time ) but it always seems to be misinterpreted as a number instead of a date . Is there a setting we are missing to tell Nevron what format the dates will be in when they are passed in ? Or do they need to be in a specific format ?& nbsp ; Any help would be very gratefully accepted !
|
|
Group: Forum Members
Last Active: Last Month
Posts: 3,055,
Visits: 4,055
|
Hi Louis , You need to specify that the line is in XY Scatter mode ( from the series options ). After you do that go to Value Grouping and assign the X value property which should be the date / time associated with each line data point . That way the line will also have date information - currently when you switch to date time numeric axis the line still uses categorical X values - 0 , 1 , 2 etc . In the case of the . NET date time format 0 maps to 1899 that ' s why you get dates around 1900 . For example check out the Technical Price Indicators example where the line series is switched to XY Scatter . Hope this helps - let us know if you meet any problems or have any questions .
Best Regards,
Nevron Support Team
|
|
Group: Forum Members
Last Active: 6 Years Ago
Posts: 2,
Visits: 21
|
Brilliant! That worked, thanks very much.
|


