Hi all,
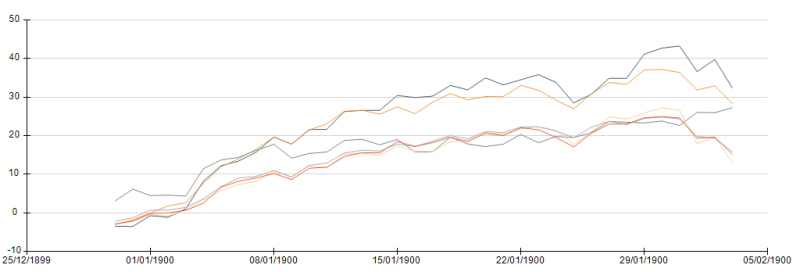
We are having an issue trying to create a line graph with Dates along the X Axis using Numerical instead of Categorical. When using Categorical it all works ok but when trying to render as Numerical we get the following
73% of original size (was 693x19) - Click to enlarge

These dates should be from Jan 2016-August 2018 and not 1900 as the graph shows.
We have tried passing data through in a number of formats (yyyy-MM-dd, dd/MM/YYYY, including and excluding time) but it always seems to be misinterpreted as a number instead of a date.
Is there a setting we are missing to tell Nevron what format the dates will be in when they are passed in? Or do they need to be in a specific format?
Any help would be very gratefully accepted!