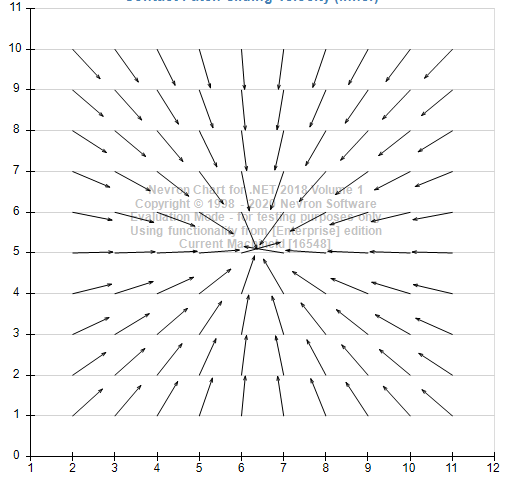
Hello,
I'm trying to plot a Vector2D chart of some data.
Due to the size of the vectors I'm only really interested in their position and direction, and just want to resize the vectors relative to my axes.
As I understand it, the option Mode.Direction should allow me to do this, with
vectorSeries.XValues and vectorSeries.Values becoming the X and Y positions, and vectorSeries.X2Values and vectorSeries.Y2Values becoming the X and Y directions.
I can then resize the relative size of the arrows using MinVectorLength and MaxVectorLength.
However, when I implement this, I end up with all the vector arrows starting at positions based of vectorSeries.XValues and vectorSeries.Values but with directions that point into the centre of the plot.
In the case of the Nevron2D plot (
http://examplesaspnetchart.nevron.com/) the arrows point to roughly (6.5, 5).
73% of original size (was 689x19) - Click to enlarge

I see this behaviour in all sets of data I've tried (e.g. if the origin is in the centre of the chart, all vectors point towards the origin).
If anyone has any suggestions as to what is going on (or what I'm doing wrong), I'd be very happy to hear them!