Hi,
I'm using a triangulated surface to represent a stock of raw material with diffrent heights with data coming from a database. In this database, the stock is splitted into cells with the coordinates of the center and the 2D cell size, then, for each cells I have a value of height and a product type.
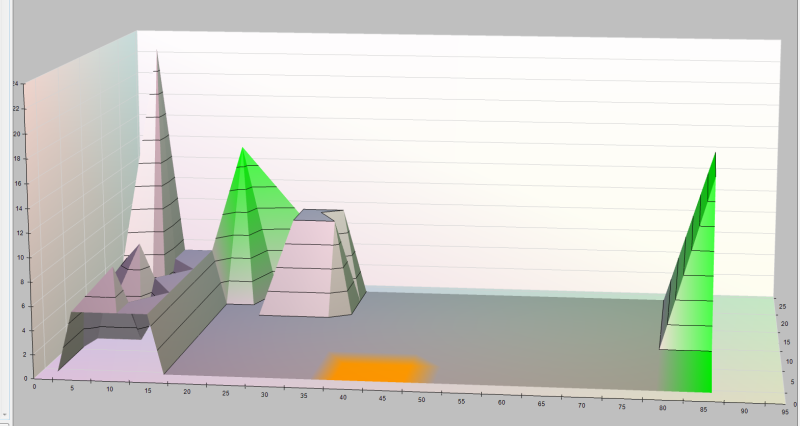
When I plot these data into a triangulated surface by giving only the coordinates of the center of the cell and the height it displays some sort of pyramidal shapes like this:
73% of original size (was 694x19) - Click to enlarge

I would like to be able to display the correct cell sizes, typically the green pyramidal on the left-back is in fact a silo so the material inside is not in shape of a pyramid and should not finish in a single point but in a square.
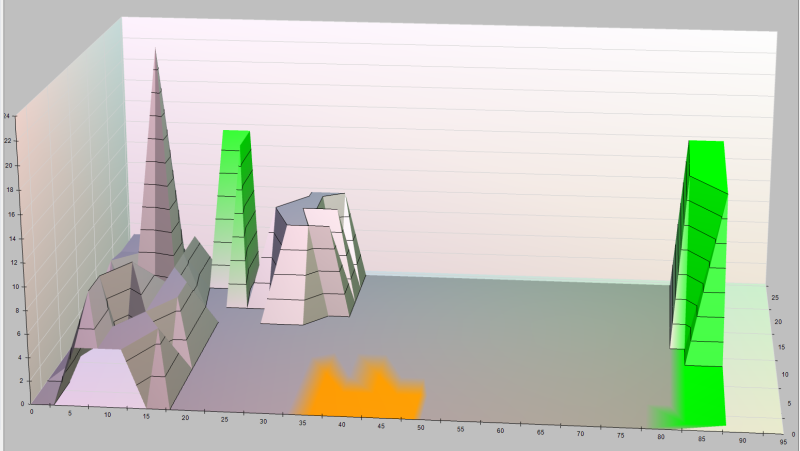
I tried, instead of plotting one point per cell, to add 4 point per cell (the 4 angles calculated from the center coordinate and the cell dimension) but here's what is displayed:
73% of original size (was 694x19) - Click to enlarge

This is the code I used for the one-point-per-cell graph:
For i As Integer = 0 To pCells.Count - 1
Dim x As Integer = (pCells(i).Position.X - minX) / scaleFactor
Dim y As Integer = (pCells(i).Position.Y - minY) / scaleFactor
Dim z As Double = (pCells(i).Height - minZ) / scaleFactor
FSurfaceSeries.XValues.Add(x)
FSurfaceSeries.ZValues.Add(y)
FSurfaceSeries.Values.Add(z)
FSurfaceSeries.Colors.Add(GetColorByProduct(pCells(i).Produit))
Next
And the same but for four-points-per-cell graph:
For i As Integer = 0 To pCells.Count - 1 Dim x1 As Integer = (pCells(i).Position.X - pCells(i).Dimension.Width / 2 - minX) / scaleFactor
Dim x2 As Integer = (pCells(i).Position.X + pCells(i).Dimension.Width / 2 - minX) / scaleFactor
Dim y1 As Integer = (pCells(i).Position.Y - pCells(i).Dimension.Height / 2 - minY) / scaleFactor
Dim y2 As Integer = (pCells(i).Position.Y + pCells(i).Dimension.Height / 2 - minY) / scaleFactor
Dim z As Double = (pCells(i).Height - minZ) / scaleFactor
'Top-left
FSurfaceSeries.XValues.Add(x1)
FSurfaceSeries.ZValues.Add(y1)
FSurfaceSeries.Values.Add(z)
FSurfaceSeries.Colors.Add(GetColorByProduct(pCells(i).Produit))
'Top-right
FSurfaceSeries.XValues.Add(x2)
FSurfaceSeries.ZValues.Add(y1)
FSurfaceSeries.Values.Add(z)
FSurfaceSeries.Colors.Add(GetColorByProduct(pCells(i).Produit))
'Bottom-right
FSurfaceSeries.XValues.Add(x2)
FSurfaceSeries.ZValues.Add(y2)
FSurfaceSeries.Values.Add(z)
FSurfaceSeries.Colors.Add(GetColorByProduct(pCells(i).Produit))
'Bottom-left
FSurfaceSeries.XValues.Add(x1)
FSurfaceSeries.ZValues.Add(y2)
FSurfaceSeries.Values.Add(z)
FSurfaceSeries.Colors.Add(GetColorByProduct(pCells(i).Produit))
NextPlease note that for me the 2D base (or projection) is having X-Y coordinates and the elevation(or height) is in the 3rd coordinate Z, that's why I'm adding coord y to the Zvalues and coord Z to the values.
Thank you for your help,
Best regards,
Joël