Profile Picture

TriangulatedSurfaceChart with empty data points

Posted By joern kunze 10 Years Ago
Author
Message
joern kunze
Question Posted 10 Years Ago
View Quick Profile
Junior Member

Junior Member (13 reputation)Junior Member (13 reputation)Junior Member (13 reputation)Junior Member (13 reputation)Junior Member (13 reputation)Junior Member (13 reputation)Junior Member (13 reputation)Junior Member (13 reputation)Junior Member (13 reputation)

Group: Forum Members
Last Active: 3 Months Ago
Posts: 86, Visits: 221
Hi Experts,
SnippetI want to display grid based measurement data (X: 1,2,3.. Z:1,2,3) but with empty data points and no interpolation at all between data points.
So far I found a way to do it with NTriangulatedSurfaceSeries - here is a rough example with just 4 data points - where one data point is empty:
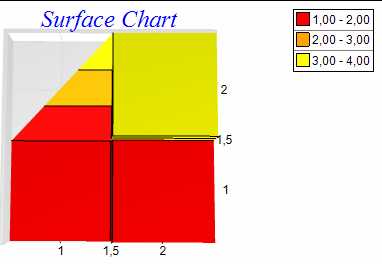
https://www.nevron.com/forum/uploads/images/90963ff0-7c01-41ae-993d-bdaa.jpg

Unfortunatly, I could not find a way to handle empty data points.
The upper left square should be completly empty since all corner values are NaN - but it isnt.

Is there a way to achieve this?
Or is there even an easier and better way than using Triangulated surface chart ? Basically I have transformed each measured data point to 4 points representing the points very close to the corner of the measured data point within the measurement grid - for example measurement point represented by the upper right yellowish square (X=2, Z=2 with value 3.1) is transformed to:
Snippet
surface.XValues.AddRange( new double[] {1.51, 1.51, 2,49, 2.49} );Snippet
surface.ZValues.AddRange( new double[] {1.51, 2.49, 1.51, 2.49});
Snippet
surface.Values.AddRange( new double[] {3.1, 3.1, 3.1 , 3.1});
This approach works (except for empty data points which are double.NaN) - but looks clumsy somehow ...

Thanks a lot for your help,
Joern

Nevron Support
Posted 10 Years Ago
View Quick Profile
Supreme Being

Supreme Being (4,435 reputation)Supreme Being (4,435 reputation)Supreme Being (4,435 reputation)Supreme Being (4,435 reputation)Supreme Being (4,435 reputation)Supreme Being (4,435 reputation)Supreme Being (4,435 reputation)Supreme Being (4,435 reputation)Supreme Being (4,435 reputation)

Group: Forum Members
Last Active: Last Week
Posts: 3,054, Visits: 4,009
Hi Joern,

The grid surface also regards empty data points - check the following example:

NCartesianChart chart = (NCartesianChart)nChartControl1.Charts[0];

chart.Enable3D = true;

chart.Width = chart.Height = chart.Depth = 40;

chart.Projection.SetPredefinedProjection(Nevron.GraphicsCore.PredefinedProjection.OrthogonalTop);

NGridSurfaceSeries gridSurface = new NGridSurfaceSeries();

gridSurface.Data.SetGridSize(3, 3);

for (int i = 0; i < gridSurface.Data.GridSizeX; i++)

{

for (int j = 0; j < gridSurface.Data.GridSizeZ; j++)

{

gridSurface.Data.SetValue(i, j, i * j);

}

}

gridSurface.Data.SetValue(0, 2, double.NaN);

chart.Series.Add(gridSurface);

nChartControl1.Controller.Tools.Add(new NPanelSelectorTool());

nChartControl1.Controller.Tools.Add(new NTrackballTool());

Hope this helps - let us now if you meet any problems...


Best Regards,
Nevron Support Team


joern kunze
Posted 10 Years Ago
View Quick Profile
Junior Member

Junior Member (13 reputation)Junior Member (13 reputation)Junior Member (13 reputation)Junior Member (13 reputation)Junior Member (13 reputation)Junior Member (13 reputation)Junior Member (13 reputation)Junior Member (13 reputation)Junior Member (13 reputation)

Group: Forum Members
Last Active: 3 Months Ago
Posts: 86, Visits: 221
Thanks a lot for the reply - unfortunatly I still cant get it working the way I want. I already tried NGridSurfaceSeries in the first place since it can work with NaN-values.
But there are 2 major drawbacks:
1. There is always interpolation between adjacent squares of the grid - but I want to color each single square of the underlying grid with just one color
2. When I run the example, it is all colored in the same color when viewd from the top:

https://www.nevron.com/forum/uploads/images/6e5d8110-b520-4e8f-adca-b088.jpg

Basically, I am looking for a way to make the example look like:

https://www.nevron.com/forum/uploads/images/e21f93d6-58d2-41d0-9dfe-ad72.jpg

Is there a way to do so?

Thanks again,
Joern


Nevron Support
Posted 10 Years Ago
View Quick Profile
Supreme Being

Supreme Being (4,435 reputation)Supreme Being (4,435 reputation)Supreme Being (4,435 reputation)Supreme Being (4,435 reputation)Supreme Being (4,435 reputation)Supreme Being (4,435 reputation)Supreme Being (4,435 reputation)Supreme Being (4,435 reputation)Supreme Being (4,435 reputation)

Group: Forum Members
Last Active: Last Week
Posts: 3,054, Visits: 4,009
Hi Joern,

We're going to have a heat map series in the upcoming new version that will solve this problem. How urgent is this for your project?


Best Regards,
Nevron Support Team


joern kunze
Posted 10 Years Ago
View Quick Profile
Junior Member

Junior Member (13 reputation)Junior Member (13 reputation)Junior Member (13 reputation)Junior Member (13 reputation)Junior Member (13 reputation)Junior Member (13 reputation)Junior Member (13 reputation)Junior Member (13 reputation)Junior Member (13 reputation)

Group: Forum Members
Last Active: 3 Months Ago
Posts: 86, Visits: 221
... unfortunatly it is rather urgent - it is scheduled to be working at the end of this month.

Best regards,
Joern


Similar Topics


Reading This Topic